Today we’ll look at enabling Azure Data Factory Diagnostic Settings. Do this to enhance the governance of your Azure Data Factory solutions, deploy Log Analytics solutions and query logs looking for specific information.
Table of Contents
Introduction
If you develop data movement solutions, you know how important it is to capture information related to the orchestration of data movement activities. This information allows you to answer questions like:
- Why did the Azure Data Factory overnight job fail?
- Is this process taking longer than a few days ago?
- What are the most time-consuming activities?
- How can I decrease on-going costs?
- Who triggered the pipeline?
Most data movement tools offer these logs and Azure Data Factory is not the exception.
Azure Data Factory captures data and then you can look at it using the Monitor section. However, old data will be deleted. To overcome these limitations, you can enable Log Analytics.
Enable Diagnostic Settings
To begin, in order to enable diagnostic settings, just redirect to the Diagnostic Section within Azure Data Factory. This applies to most services in Azure.

Then, once you’ve opened this option, you can configure which logs you want to capture and where. In my case, I don’t want to capture all the information and I’d like to send it to Log Analytics.

Be aware that by sending data to Log Analytics, you’ll be charged for storing this data. The service is extremely cost-effective, but in some scenarios, you need to be cautious about how you are using it. A highly transactional log application can easily generate a lot of logs (aka Azure Synapse Analytics).
Start Querying Log Analytics
Next, after enabling the Diagnostic Settings and sending data to Azure Log Analytics, you can start writing some queries.
Navigate to Azure Log Analytics first.

After that, find your workspace.

Next, browse the Log options.

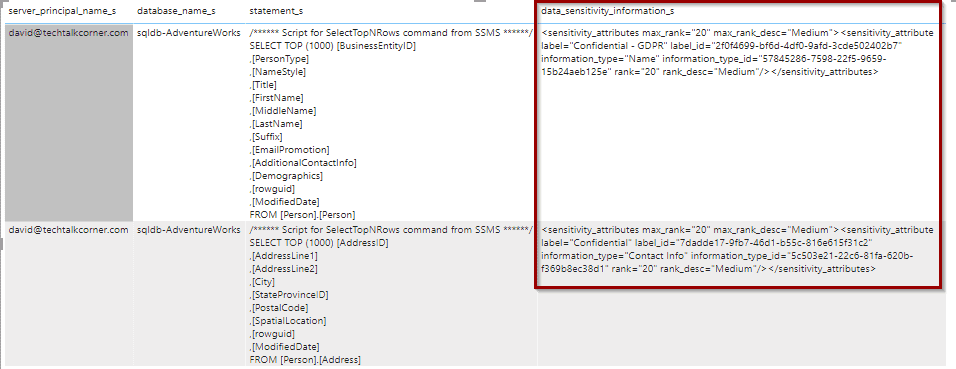
Now you are ready to start writing queries and you can also export them to Power BI (see my previous post on Data Classification to find out how)
ADFPipelineRun 
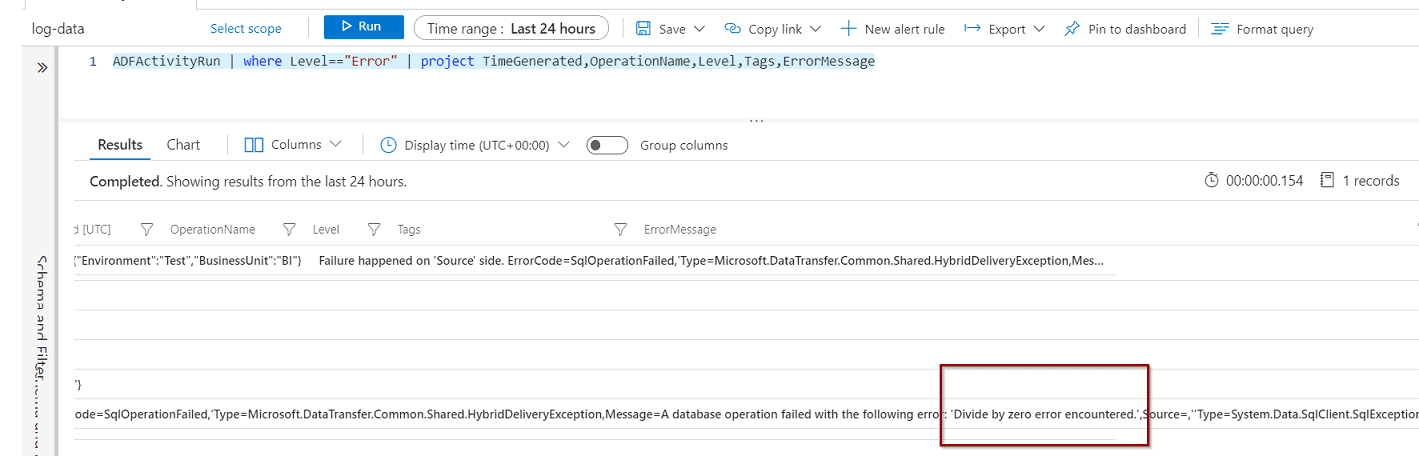
Another good example is that you can get specific information about the error messages in case of failure by using, for example, ADFActivityRuns.
ADFActivityRun | where Level=="Error" | project TimeGenerated,OperationName,Level,Tags,ErrorMessage 
By using Log Analytics, you have more flexibility than using the Monitor Hub in Azure Data Factory.
Summary
To summarize, you’ve seen how to enable Diagnostic Settings and query Log Analytics in order to discover information related to your Azure Data Factory solutions.
Final Thoughts
I always try to avoid reinventing the wheel when developing solutions. Building frameworks to store every single piece of information related to data movement is out of scope for me. Using Log Analytics for Azure Data Factory certainly enhances the governance of your process.
What’s Next?
In upcoming blog posts, we’ll continue to explore some of the features within Azure Services.
Please follow Tech Talk Corner on Twitter for blog updates, virtual presentations, and more!
Please leave any comments or questions below.