


Do you know how to enable Azure Data Factory alerts in case of failure? This is one of the great capabilities to consider when developing solutions.
In this blog post, you will learn how to:
- Create and configure alerts for Azure Data Factory
- Monitor alerts
- Opt-out an action group
You can create the alerts by using Azure monitor alerts. You can access them from your Azure Data Factory or Azure Alerts.

Table of Contents
Create New Azure Alert Rule
First, click “New alert rule” to get started.

When creating alerts, you need to configure four different options:
- Scope – the service(s) that you are monitoring.
- Condition – the rule that needs to be met to trigger the alert.
- Action group – the action to execute after the alert is triggered.
- Alert rule details – the name and description of the alert.
Scope
If you have entered the alerts option from your Azure Data Factory, the information will be filled in automatically.

However, if you have entered the alerts from Azure Monitor Alerts, you have to select the services that you want to monitor.

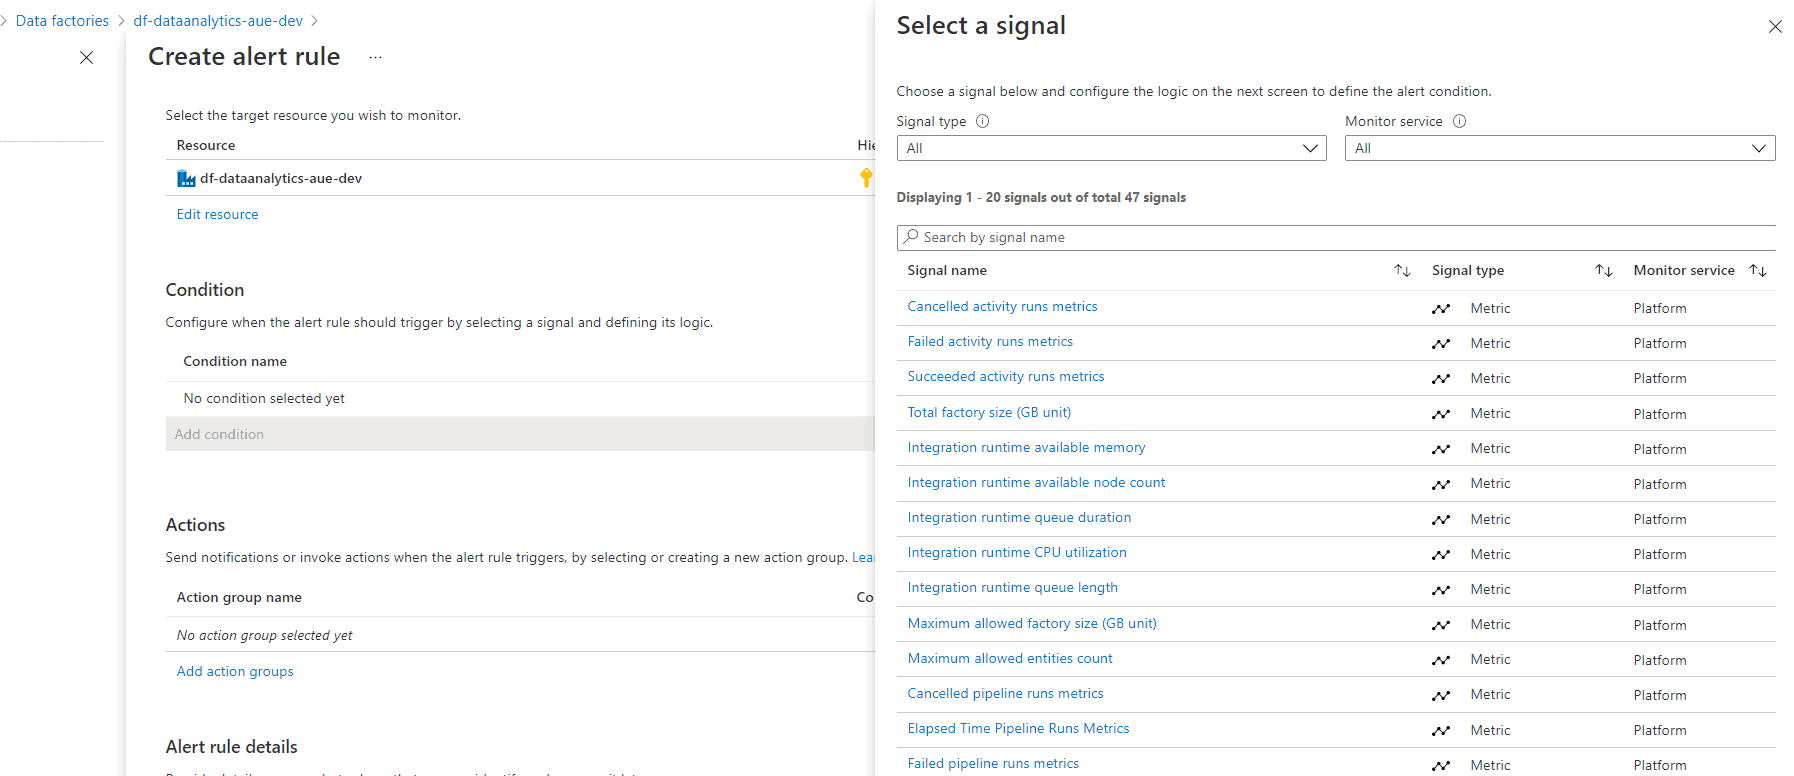
Condition
When configuring the condition, all the metrics available for Azure Data Factory are going to be displayed. The number of metrics has increased significantly during the past few years, as well as analytics for information in the log.

In this case, to enable the alerts in case of failure, just filter by failed and select “Failed pipeline runs metrics.” This will cover the majority of failures as data flows and SSIS packages run within pipelines.

When selecting the metric, you need to configure how to aggregate the information and the frequency of evaluation. Then, click done.
In the following picture, I have selected the alert to evaluate failures every 15 minutes (for the previous 15 minutes.)

Additionally, you can filter by specific pipeline names of error type if required. This is really useful when you require more control over the criticality of your data movement.
Filtering by pipeline name

Filtering by error type

Finally, after saving the condition, you will see that it is available in the configuration page.

Create Azure Alerts Action Group
Action groups are independent objects from alerts and you can reuse them.
An action group can be defined by using the following option:

Or in this case, directly from the alert.

For the action group, you must configure a few options.
- Basics – basic details of the action group
- Notifications – delivery notification method (email, SMS, call, etc.)
- Actions – an additional action to trigger (for example Azure functions or Webhooks)
- Tags
- Review and create
Basics
Let’s define some basic information for the action group.

Notifications
In this case, I am the only member of this action group and will configure the email and SMS delivery options. Each delivery method has different costs.

Actions
For this tutorial, I won’t define any actions, but the option is available to you.

Tags, review and create
Once you are ready, create the action group.


Once you are back on the alerts configuration page, you will see the action group. It’s also possible to define multiple action groups.

Alert rule details
Finally, the last step is to define a name, a description, and the severity level for your alert.
There are different severity levels defined by Microsoft in Azure:
- 0 = Critical
- 1 = Error
- 2 = Warning
- 3 = Informational
- 4 = Verbose

Testing the alert
To test the alerts, I have a simple pipeline with a lookup activity that tries to divide by zero.

After triggering the alert, I received the following notifications:

SMS

Monitoring the alerts
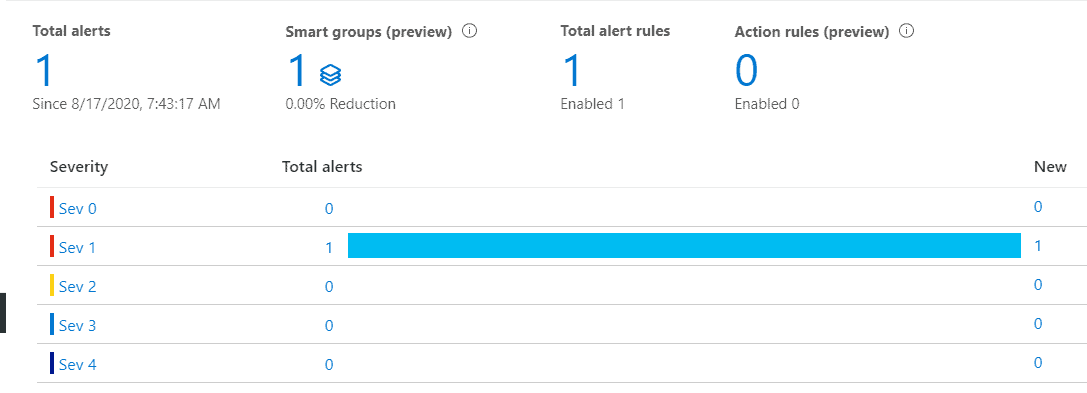
In case you want to know which alerts have been triggered, you can do this by going to the alerts option.

Did someone accidentally add you to an action group?
When you’re added to an action group, you will receive a notification. You can disable it if you don’t want to receive any alerts.

SMS

An option for disabling the alerts is available in the alert configuration.

Summary
In this blog post, we reviewed how to easily enable alerts for Azure Data Factory failures using the different metrics available within Azure Monitor.
Final Thoughts
Complementing your Azure Data Factory solutions with good monitoring capabilities is a practice that you need to take into account for new or mature environments.
Having alerts helps you respond to critical and non-critical issues in production environments.
What’s Next?
In upcoming blog posts, we’ll continue to explore some of the features within Azure Services.
As always, please leave any comments or questions below.
If you haven’t already, you can follow me on Twitter for blog updates, virtual presentations, and more!

11 Responses
Dinesh Tather
27 . 04 . 2021Hi David,
Nice explanation, I am looking for some more details on elapsed time pipeline run metrics. Ideally it looked like it is the elapsed time of the pipeline run but strangely it does not pick anything for the running pipelines even which are over an hour of run. Can you please let me know if you know how to do that or what I am really looking for is an alert on long running pipelines which are running for over an hour.
Thanks
Dinesh Tather
David Alzamendi
28 . 04 . 2021Hi Dinesh,
Elapsed Time might be looking at completed pipelines, so I don’t beleive you will get it that way.
For testing an alternative, enable log analyticcs (only pipeline runs will be enough) as described at: https://davidalzamendi.com/azure-data-factory-governance-and-log-analytics/
Then you can write a query like this one:
ADFPipelineRun | where Status =="InProgress" |where RunId !in (( ADFPipelineRun | where Status in ("Succeeded","Failed","Cancelled") | project RunId ) )
| where datetime_diff('minute',now(),Start) >60
The 60 at the end is the number of minutes, then you can create an alert with that query.
The status Cancelled is missing in the picture below.
I might be missing something but I might write about this in the upcoming weeks.
Let me know how you go or if I can provide more information.
Regards,
David Alzamendi
04 . 05 . 2021Created a blog post about this one https://davidalzamendi.com/long-running-azure-data-factory-pipelines/
datapro
11 . 05 . 2021The automated email is not telling us which pipeline got failed, is there is any way we can find which pipeline got failed by doing some setting in alert metrics it self. Currently, I have selected all the pipeline and activity names. But one of those pipeline/activity got failed and I am interested to know that name should come in my email alert
David Alzamendi
12 . 05 . 2021Hi datapro,
The easiest solution is to create additional alerts for the pipelines that are critical and filter the alert so it works only for that pipeline (using the dimensions filters). You can assign specific names to these alerts, so when you receive them, you know which pipeline failed.
Other options that will require more effort are creating custom Azure Functions, using Azure Logic Apps or there is a new option to use custom payloads for Alerts that I haven’t explored yet.
Regards,
David
Jayesh
27 . 05 . 2021Hi David,
Is it possible to create these alerts using IAC (terraform). Sorry for asking irrelevant question.
David Alzamendi
27 . 06 . 2021Hi Jayesh,
I haven’t done it, but it seems to be possible:
https://registry.terraform.io/providers/hashicorp/azurerm/latest/docs/resources/monitor_metric_alert
I am not an expert in terraform, but happy to provide further assistance.
Regards,
David
pradyot mohanty
13 . 07 . 2021Hi David, can we have some document or some reference where we can figure out what is the cost for each of the alert that we can set and then further processing cost and analysis please
Ram
16 . 09 . 2021Hi David, i am not able to find any metrics in the alerts tab in ADF, no metrics comes in the dropdown. i only have activity logs, please telme how do we make the metrics show up. thanks
David Alzamendi
17 . 09 . 2021Hi Ram,
Can you please share a screenshot of what you see?
The metrics are here:
Hanna
20 . 10 . 2023Hi David, could you help me? I would like to monitor the pipeline runs of 60 datafactory, but I need it to be alerted in real time and without duplicate alerts, that is, if it alerts once it should not alert again, so I cannot simply set Status == Failed, because if If I do this there will be a risk of duplication, could you give me a suggestion?