Today, you’ll learn how to enhance the monitoring activities for your Azure Data Factory using Azure Data Factory Analytics. This is a workbook built on top of your Azure Log Analytics Workspaces.
Monitoring Azure Data Factories is a time-consuming activity. This is especially true if you need to run daily checks for a Production environment or during the development phase of a large project.
Azure Data Factory Analytics allows you to deploy a dashboard with different insights on the status of your Azure Data Factory pipelines and activities.
Table of Contents
Pre-requirements
Before you begin, make sure to enable Diagnostic Settings for the Azure Data Factories that you want to monitor.
Check my previous blog post for a guide
Deploy Azure Data Factory Analytics
To start, find Azure Log Analytics in the Azure marketplace.

Select your Log Analytics Workspace and click Create.

Next, navigate to your Log Analytics Workspace.

The solution has been added to the Workbooks section.

You can change the time range. The scroll bar is long because the workbook includes a lot of different visualizations.

The pre-built visualizations in the solution are:
- ADF Runs – 1) Pipeline Runs by Data Factory
- ADF Runs – 2) Activity Runs by Data Factory
- ADF Runs – 3) Trigger Runs by Data Factory
- ADF Errors – 1) Top 10 Pipeline Errors by Data Factory
- ADF Errors – 2) Top 10 Activity Runs by Data Factory
- ADF Errors – 3) Top 10 Trigger Errors by Data Factory
- ADF Statistics – 1) Activity Runs by Type
- ADF Statistics – 2) Trigger Runs by Type
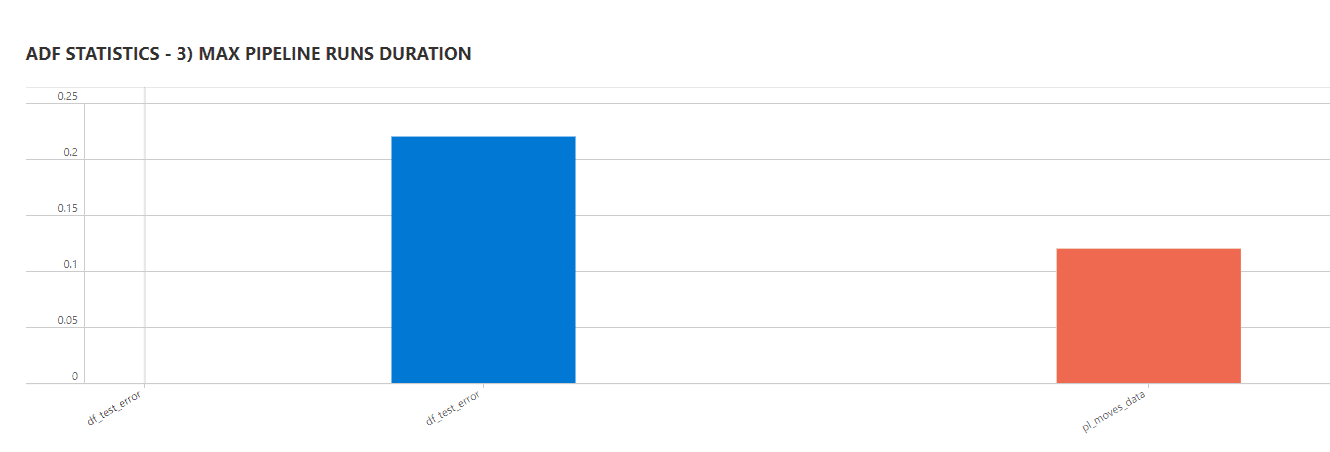
- ADF Statistics – 3) Max Pipeline Runs Duration
A few examples:
ADF STATISTICS – 3) MAX PIPELINE RUNS DURATION

ADF ERRORS – 1) TOP 10 PIPELINE ERRORS BY DATA FACTORY

Customize Azure Data Factory Workbook
While the workbook and the pre-built solution are an excellent starting point, you may want to customize it for your specific needs.
First, click the Edit option.

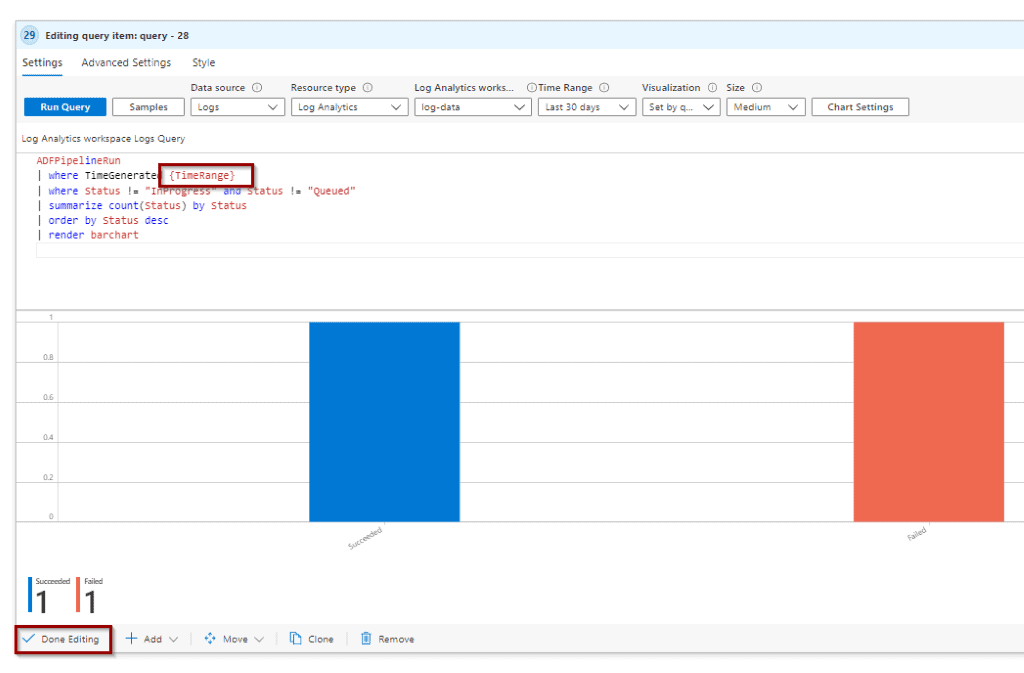
Then, you can edit existing visuals or add new visuals.

If you edit an existing visual, you’ll see the query execution in your Log Analytics Workspaces.

I am not a big fan of pie charts, so let’s say that I want to create a visual that displays the number of successes and failures as a bar chart.
First, click Add Query at the end of the workbook.

Then, copy the following code.
ADFPipelineRun

| where TimeGenerated {TimeRange}

| where Status != "InProgress" and Status != "Queued"

| summarize count(Status) by Status

| order by Status desc

| render barchart
Now you can save the visual. The {TimeRange} is the parameter defined in the dropdown at the beginning of the workbook.
Additionally, you can also add text.
### Custom 1) Display Number of Succeeded and Failed pipelines 
Share the report
The main idea is to be able to share your report so everybody can monitor the status and performance of your Azure Data Factory solutions.
Share the workbook by selecting the following option.

Let’s say that you want to share the link in an email.

The link enables users to see the Workbook without the hassle of accessing Azure Log Analytics Workspaces.

Summary
In summary, you learned how to install, configure, customize and share Azure Data Factory Analytics Workbooks using Azure Log Analytics Workspaces.
Final Thoughts
I hadn’t had the opportunity to use this solution until recently. Azure Data Factory Analytics is great, by having this solution and being able to see the query, it helps to easily extend with new insights.
What’s Next?
In upcoming blog posts, we’ll continue to explore some of the features within Azure Services.
Please follow Tech Talk Corner on Twitter for blog updates, virtual presentations, and more!
As always, please leave any comments or questions below.