


Trying to find the number of rows loaded by each activity in Azure Data Factory? Or maybe you are trying to identify which pipelines need enhancements? Or maybe how to send an email with the status of the data load? This blog post will help you monitor Azure Data Factory Activities with Power BI.
A few days ago, I got a request to help notify the number of rows loaded after executing an Azure Data Factory activity. I was also asked to monitor the performance.
You don’t need to create custom logs activities. Instead, simply enable Azure Log Analytics and create a Power BI report if you want to beautify the data that you want to send.
Enable Azure Log Analytics for Azure Data Factory
First, find the diagnostic settings in your Azure Data Factory.

There are many log options. To monitor activities, enable activity runs only.
Azure Data Factory Activity Logs help you capture:
- The duration of the activities
- Azure Data Factory Activity Rows Read and Rows Copied
- ADF Data Read and Data Written
- ADF Activity Throughput
- And much more!
Note: switching on all the options creates an increase in the ongoing cost of your Azure Log Analytics.

As you can see above, it’s also possible to send logs to storage accounts and event hubs.
Finally, don’t forget to save the options.
Table of Contents
Monitor Azure Data Factory Activities
Next, you need to find the Logs option in Azure Data Factory to monitor ADF Activities with Power BI.
Azure Log Analytics uses Kusto as the coding language, which is case sensitive.

The following query helps you capture the following information (customize it to meet your requirements):
- Subscription ID
- Azure Data Factory Name (Resource ID)
- Pipeline name and run ID
- Activity name, type and run ID
- Start and end date of the activity
- Duration of the activity, and copy operation
- Rows read and copied
- Data read and written
- Throughput
- Data Integration Units used
- Parallel Copied used
The query is filtered to only capture the past 30 days (last line)
ADFActivityRun

| where Status =="Succeeded"  // Activity has finished

| project

_SubscriptionId,

_ResourceId,

PipelineName,

PipelineRunId,

ActivityName,

ActivityRunId,

ActivityType,

Start,

End,

DurationActivitySec = datetime_diff('second',End,Start),

DataReadMBs=parse_json(Output).dataRead / 1024 /1024,

DataWrittenMBs=parse_json(Output).dataWritten / 1024 /1024,

RowsRead = parse_json(Output).rowsRead,

RowsCopied = parse_json(Output).rowsCopied,

ThroughputKBps = parse_json(Output).throughput,

CopyDurationSec = parse_json(Output).copyDuration,

UsedDataIntegrationUnits = parse_json(Output).usedDataIntegrationUnits,

UsedParallelCopies = parse_json(Output).usedParallelCopies

| where Start > ago(30d) // How back to go in time
You can save the query and pin it to the dashboard. You can also use it in a workbook as described in this blog post about Log Analytics Monitor in Azure Data Factory.
Monitor Azure Data Factory Activities with Power BI
Now it’s time to import the data into Power BI Click the Export to Power BI option.

A file with the Power BI Query Code will download.

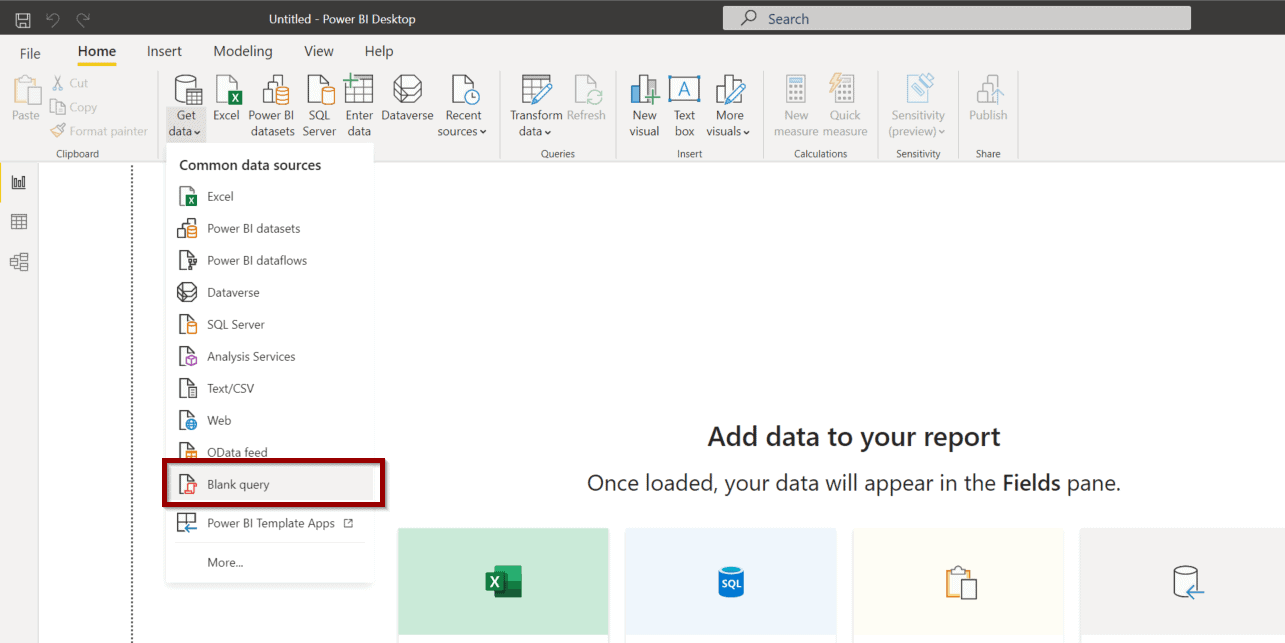
In Power BI Desktop, click Get Data and a Blank Query.
Click Advanced Editor.

In the editor, copy and paste the query from the file to monitor Azure Data Factory activities.

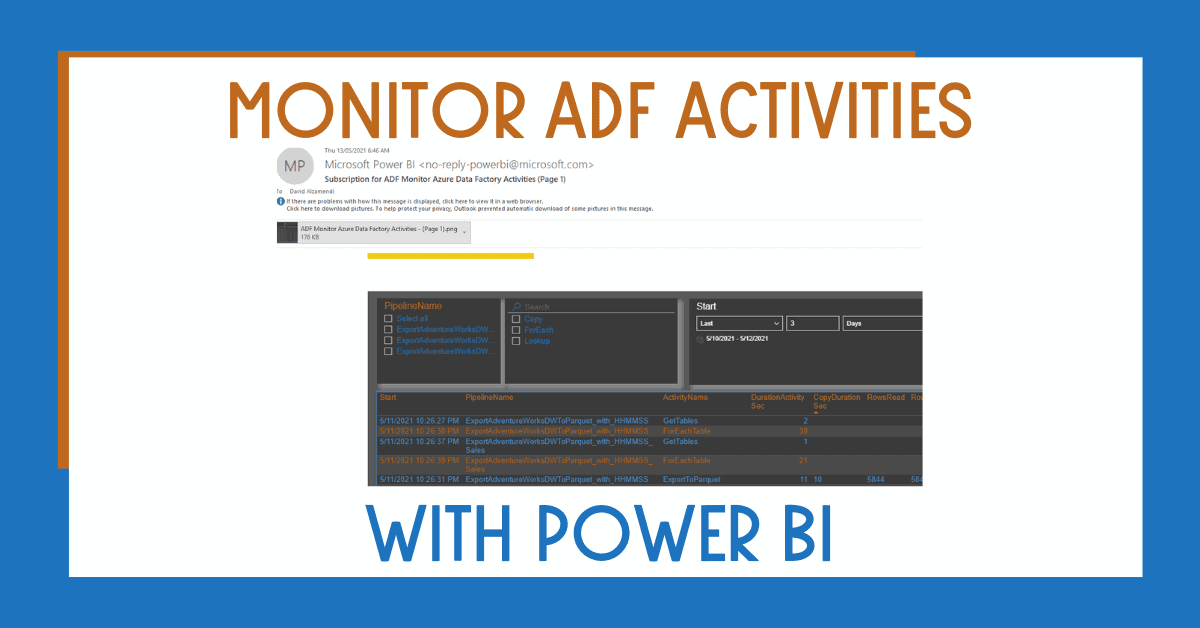
You are ready to create a Power BI report with visualizations. Example report:

If you want to send emails, publish the report to Power BI Service.
Send an email with the Summary of Your Azure Data Factory Activities
In Power BI Service, open the report and click Subscribe.
The alert will be displayed as part of the list.

Summary
To conclude, today you learned how to further customize how you monitor Azure Data Factory activities. This customization will help you identify performance bottlenecks, points for improvement and send custom Power BI summaries.
By using this approach, you don’t need to build additional capabilities to cover this functionality.
When you receive an email, you’ll receive a copy like this:

What’s Next?
In upcoming blog posts, we’ll continue to explore some of the features within Azure Services.
Please follow Tech Talk Corner on Twitter for blog updates, virtual presentations, and more!
As always, please leave any comments or questions below.

3 Responses
Adeleke Abimbola
28 . 09 . 2021Thank you for this post, it was very helpful. I have used your method to try and get the rows written by the dataflow activity in my pipeline but I didn’t get any result. Is there a different input for getting the rowsWritten for the dataFlow in log analytics? Thank you
Jay
28 . 10 . 2022Thank you David, this post was very useful and I was able to build my own PBI dashboard using your instructions.
David Alzamendi
07 . 11 . 2022Thank you for your feedback Jay, I am glad it helped.