Including Apache Spark within Azure Synapse Analytics Workspaces is one of the best features available within the service. You are able to process in-memory big data analytics activities in a Platform-as-a-Service, Pay-as-you-Go and Pay-per-Use model.
In this post, you will find a comprehensive guide to creating an Apache Spark pool, one of the Analytic Runtimes, in your Azure Synapse Analytics workspaces. I won’t go into detail about pricing at this stage.
Table of Contents
The contents of this blog post:
- Create a pool cluster
- Monitor Apache Spark
- Manage Apache Spark
Create a pool cluster
To start, creating an Apache Spark cluster is quite easy. We just need to go to the Manage Hub to create it. You can also use PowerShell for creating it.
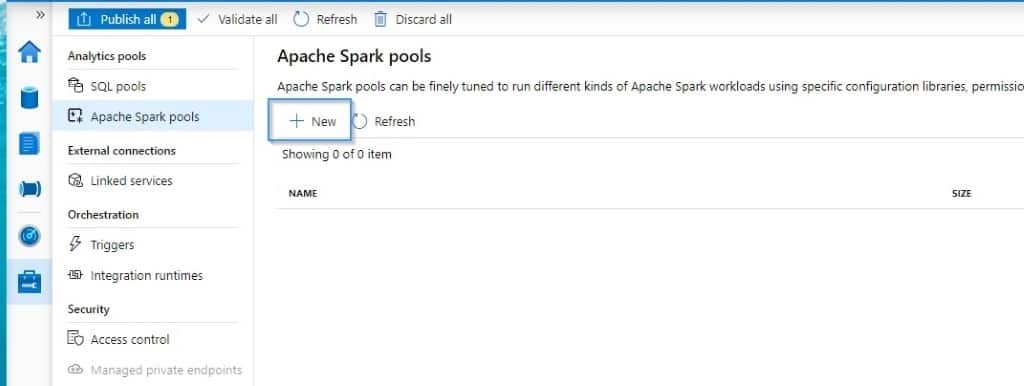
Like many other services, we need to go through different steps to complete the configuration of the pool.
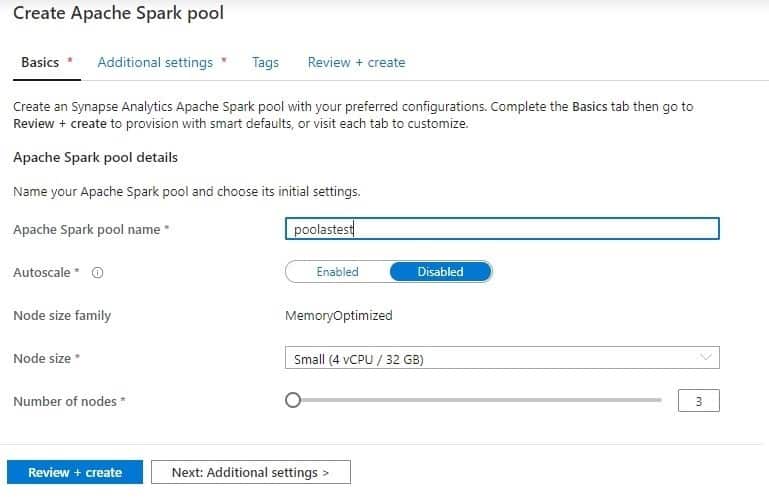
Basics
Next, you can select how the cluster size, number of nodes, and if you want auto-scale enabled or disabled.
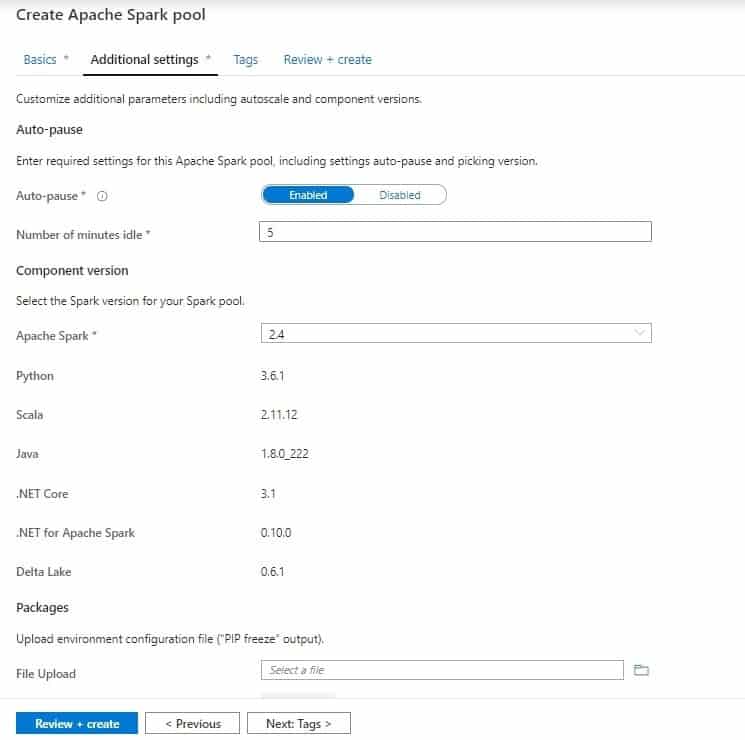
Additional Settings
In this section, if you don’t want to pay for the resources, you can enable auto-pause. Select the version (hopefully more than 2.4 will be supported in the future) and include some of your environment configuration files.
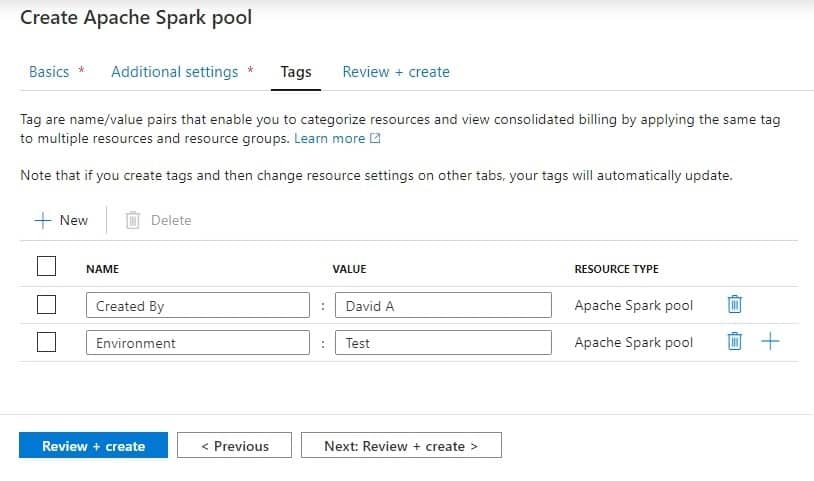
Tags
Now, it’s time to define some tags and then we’ll be ready to create the pool.
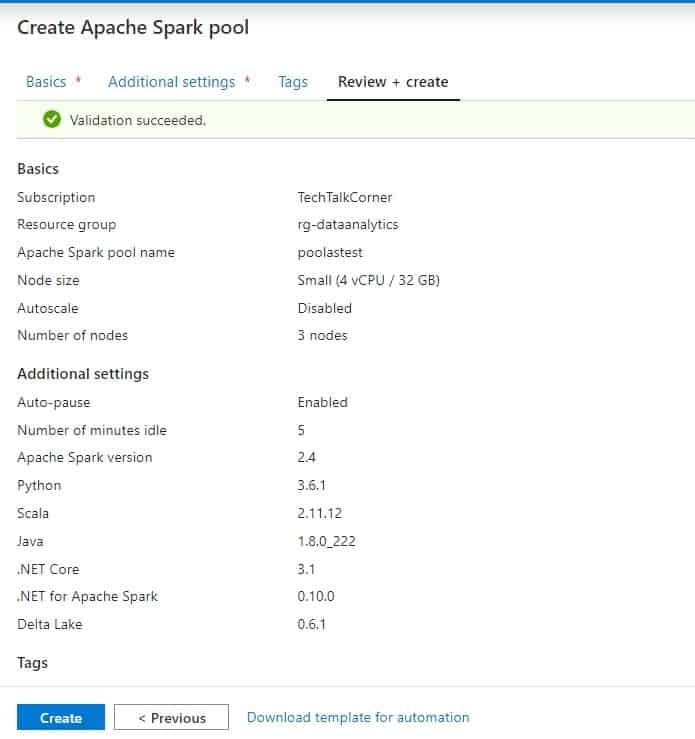
Review and Create
Finally, review the configuration that you’ve selected.
Manage Apache Spark
In the previous section, you used the Manage Hub to create a pool. This section also allows you to configure, modify, and access the dashboard.

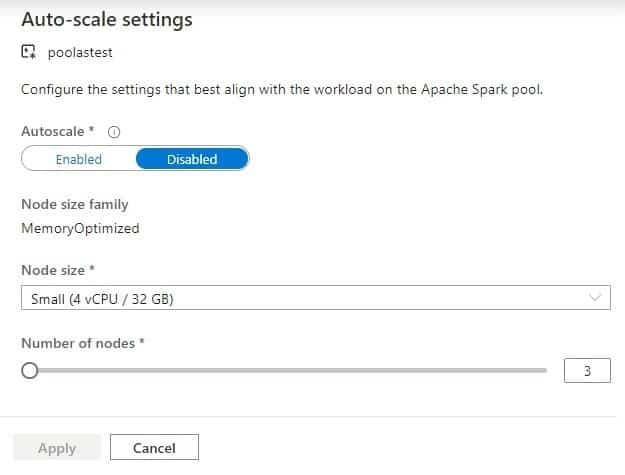
Enabling and disabling auto-scale.
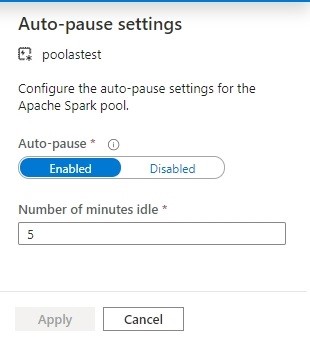
Modifying the auto-pause feature.
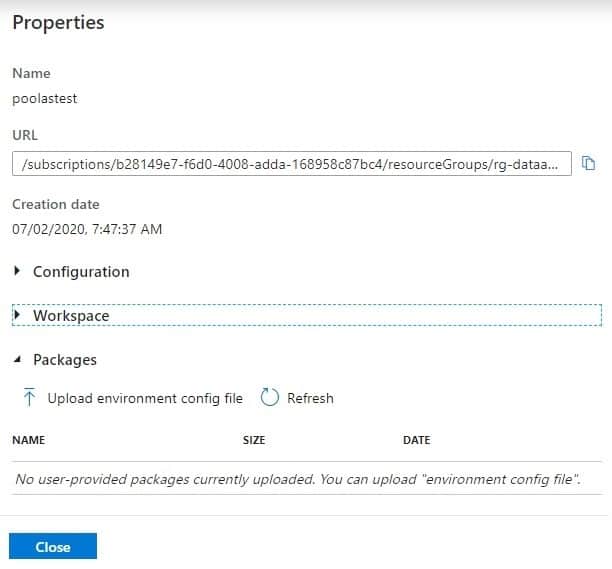
Check the properties of the pool.
Monitor Apache Spark
Azure Synapse Analytics isn’t reinventing the wheel in terms of monitoring experience. Instead, it uses the existing functionality from Apache Cluster for HDInsight. You have two options to monitor the workload in your pool:
- Monitor with Azure Synapse Analytics
- Use Apache Spark native dashboard
Monitor with Azure Synapse Analytics
You can monitor and debug activities executed in the pool by using the Monitor Hub in an Azure Synapse Analytics workspace. The majority of the information is embedded directly from the dashboard.

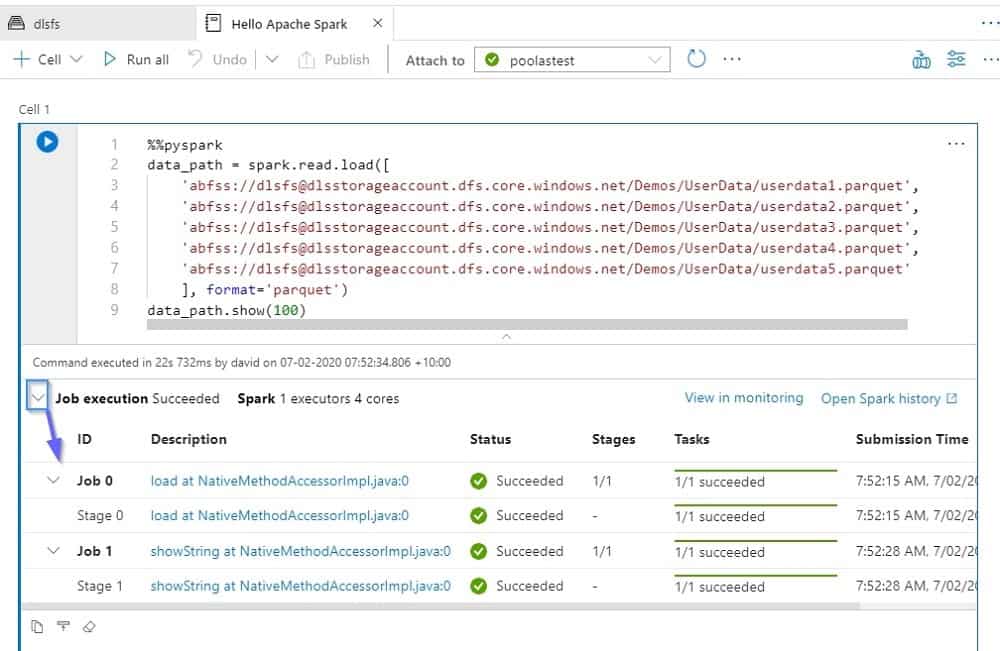
In the notebook, you can also get information about the status of the activity.
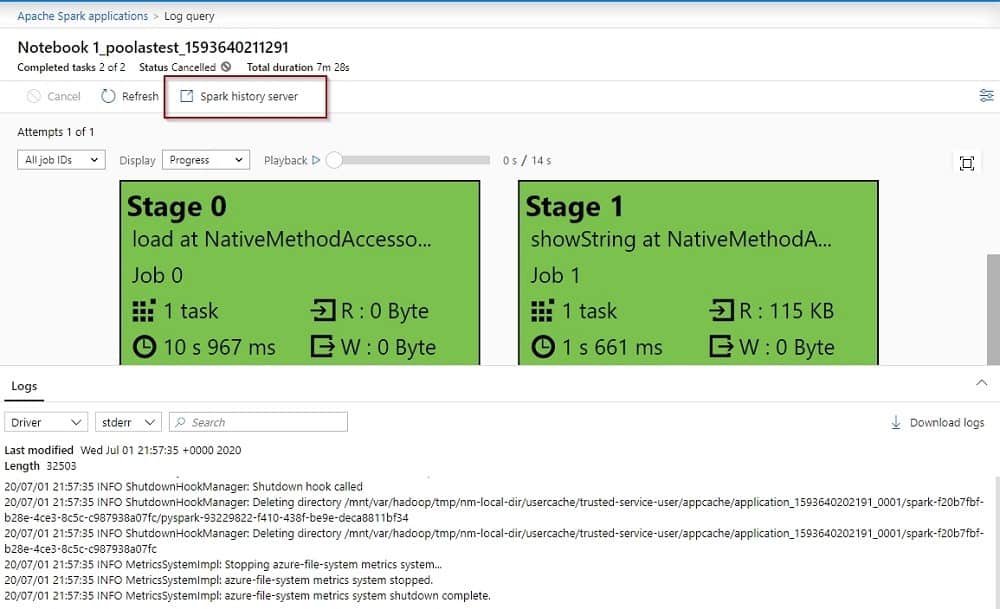
Access the dashboard by clicking on one of the activities and then on the Spark History Server option.
Use Apache Spark native dashboard
The information that is available for you on the dashboard is surprising. This information comes from the generally available Apache Cluster for HDInsight service.
You will see a summary of all your transactions on the first page and you can navigate to the following pages.

Jobs

Stages

Storage
The storage area is empty, the information is just in transit and it is not being persisted in the cluster.

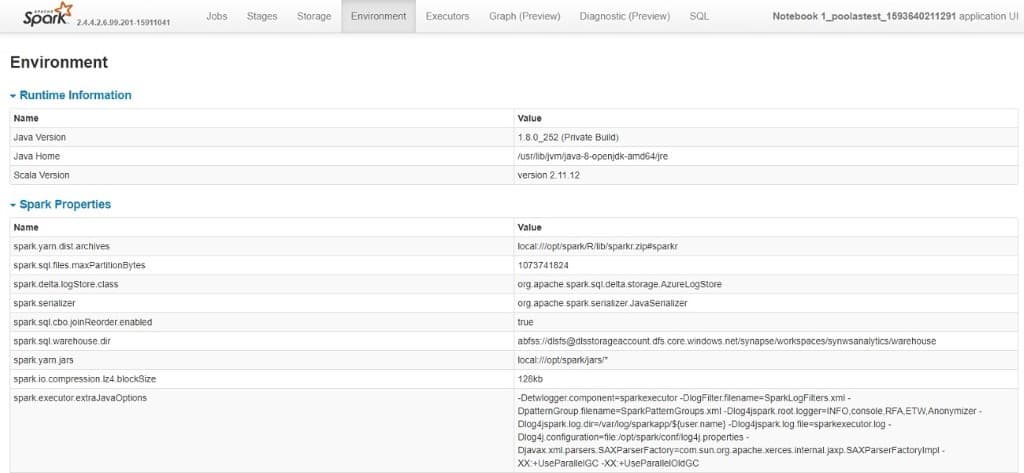
Environment
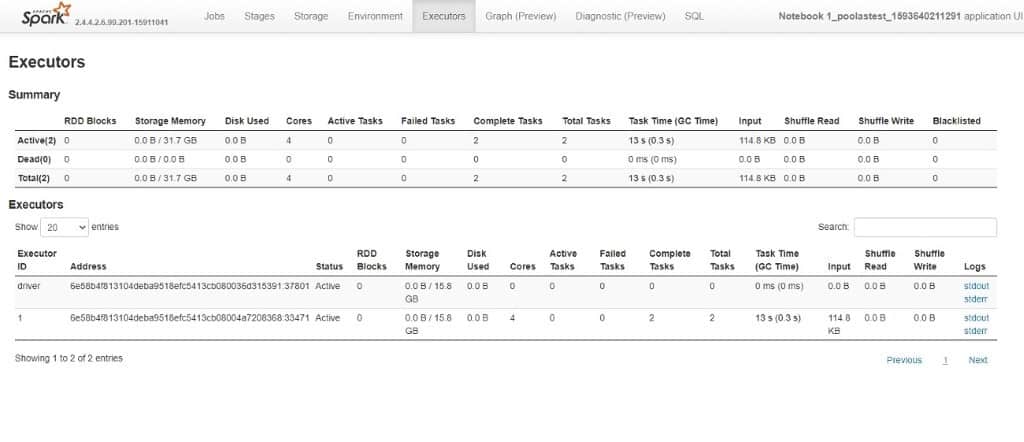
Executors
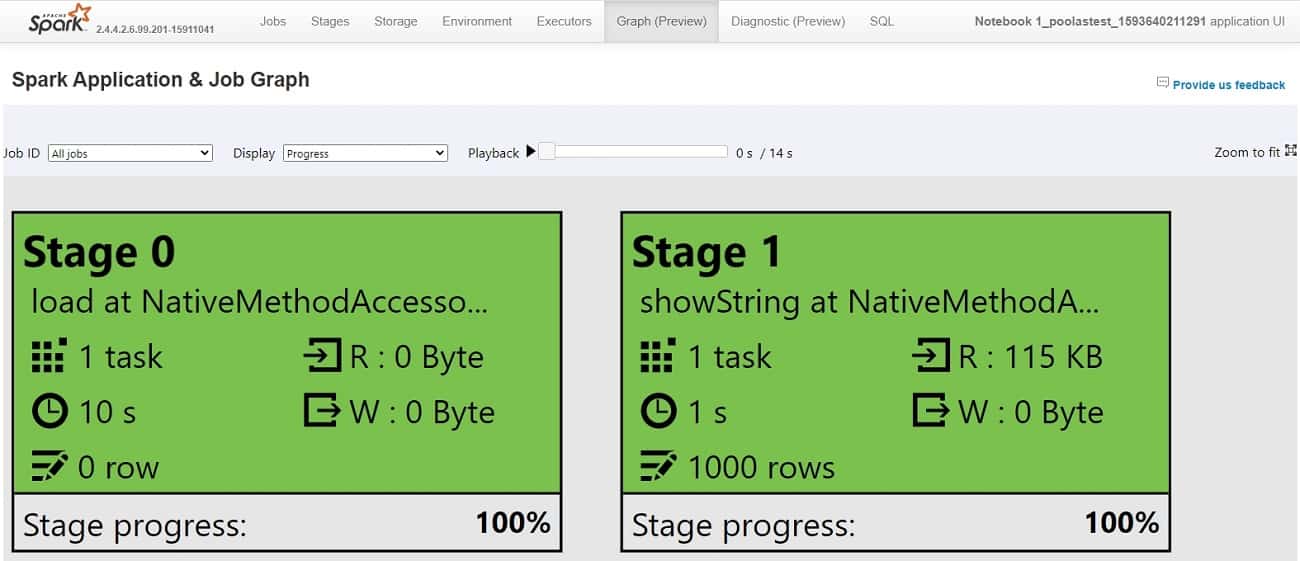
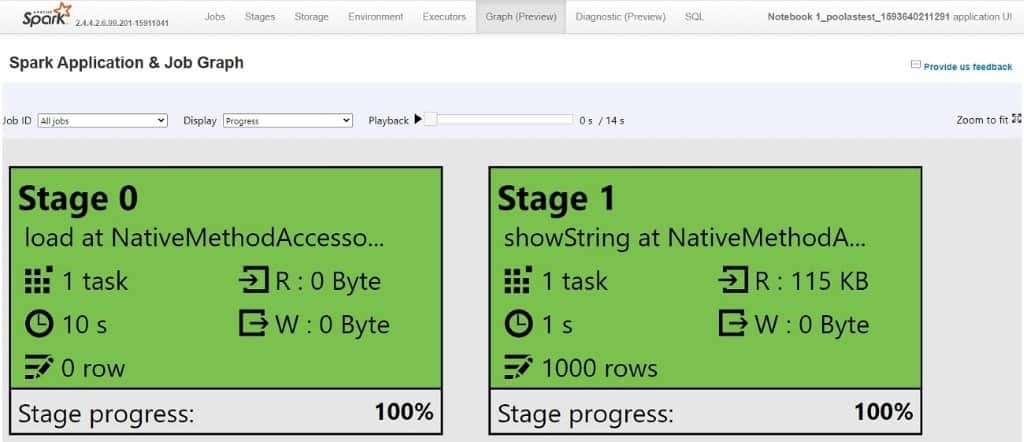
Graph
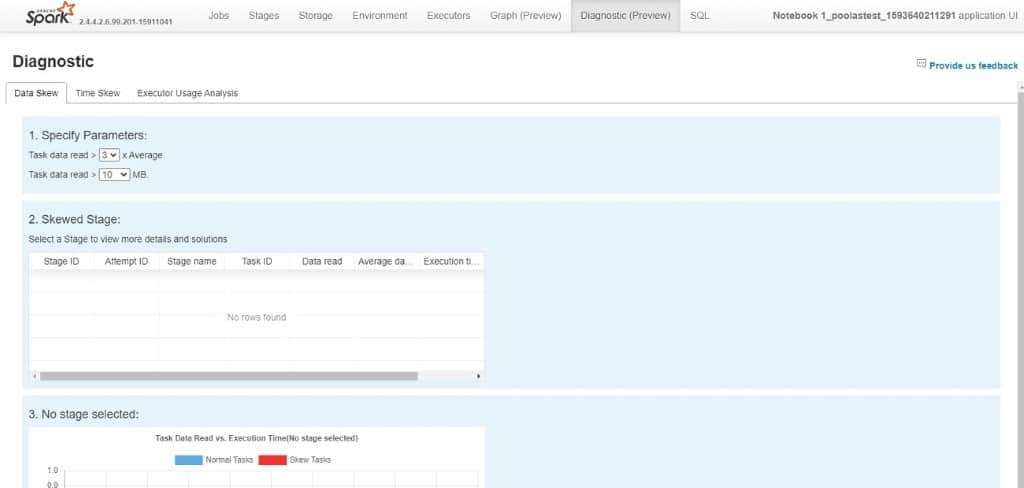
Diagnostics
SQL

Summary
Like anything in Azure Synapse Analytics Workspaces, Apache Spark pools are easy to provision, manage and monitor. Now you can start taking advantage of one of the best in-memory processing clusters.
Final Thoughts
To sum up, without reinventing the wheel or building new services, Microsoft has achieved something unique in the market, bringing two Analytical Runtimes under the same banner and offering all that we need for doing data analytics.
- SQL
- Apache Spark
What’s Next?
In my next blog posts, I’ll spend some time looking at Notebooks.


