Data skew is one of the most important considerations when working with Azure Synapse Analytics. Data skew is the uneven distribution of data across data storage distributions in SQL Dedicated Pools. In this post, you’ll learn how to monitor the data skew in your Azure Synapse Analytics SQL Pool.
Table of Contents
About Data Skew
To begin, data skew is when your data is not distributed correctly across different storage distributions. This decreases the performance of your Azure Synapse Analytics SQL Dedicated SQL Pools. This term also applies to other big data systems, including working with Apache Spark pools or other areas like machine learning or reporting.
Firstly, the main idea when understanding data skew is that a high data skew percentage is not recommended. This causes some compute nodes to work harder (more processing query time) to read and retrieve information from the tables.
Azure Synapse Analytics Dedicated SQL Pools have 60 storage distributions and when choosing the distribution key for your hash distributed tables (aka DISTRIBUTION = HASH in the creation of the table), your goal is to select the optimal column for distributing the information evenly.
Another key point is making sure your key is the same across different tables that will be queried or joined together to avoid shuffle data movement operations.
This concept mainly applies to Hash Distributed tables.

This is because replicated tables (aka DISTRIBUTION = REPLICATE) copy information (all the rows in the table) across all the available compute nodes. Then, round_robin (aka DISTRIBUTION = ROUND_ROBIN) distributes information randomly across the storage distributions.
Analysis Azure Synapse Analytics Data Skew
The following query will help you understand if there is data skew in your Azure Synapse Analytics Dedicated SQL Pools tables.
					with DataDistribution as (
SELECT
 s.name as [Schema Name]
,t.name as  [Table Name]
,tp.[distribution_policy_desc] as  [Distribution Policy Name]
,sum([row_count]) as  [Table Row Count]
,max(row_count) as  [Max Distribution Row Count]
,min(row_count) as  [Min Distribution Row Count]
,avg(row_count) as  [Avg Distribution Row Count]
from
    sys.schemas s
JOIN sys.tables t
    ON s.[schema_id] = t.[schema_id]
JOIN sys.pdw_table_distribution_properties tp
    ON t.[object_id] = tp.[object_id]
JOIN sys.pdw_table_mappings tm
    ON t.[object_id] = tm.[object_id]
JOIN sys.pdw_nodes_tables nt
    ON tm.[physical_name] = nt.[name]
JOIN sys.dm_pdw_nodes pn
    ON  nt.[pdw_node_id] = pn.[pdw_node_id]
JOIN sys.pdw_distributions di
    ON  nt.[distribution_id] = di.[distribution_id]
JOIN sys.dm_pdw_nodes_db_partition_stats nps
 ON nt.[object_id] = nps.[object_id]
    AND nt.[pdw_node_id] = nps.[pdw_node_id]
    AND nt.[distribution_id] = nps.[distribution_id]
where tp.[distribution_policy_desc] ='HASH'
 -- AND t.name = @tbl
GROUP BY
  s.name
,t.name
,tp.[distribution_policy_desc]
)
Select [Schema Name],
	   [Table Name],
	   [Distribution Policy Name],
	   [Table Row Count],
	   [Max Distribution Row Count],
	   [Min Distribution Row Count],
	   [Avg Distribution Row Count],
	   CASE WHEN [Table Row Count] = 0 then -1
	   else abs([Max Distribution Row Count] * 1.0 - [Min Distribution Row Count]*1.0) / [Max Distribution Row Count] * 100.0
	   END  as [Table Skew Percent]
FROM DataDistribution
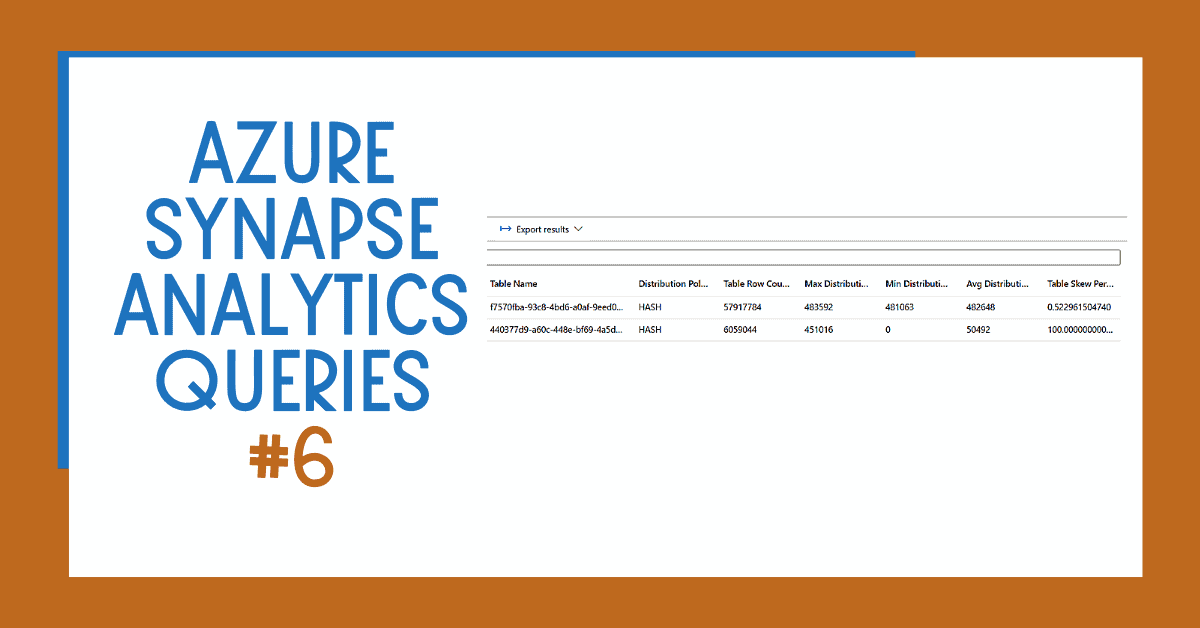
Query results with data skew percentage for each one of your Azure Synapse Analytics tables.

You can see in the results that one of my tables has a 100% data skew. This is because some of the storage distributions don’t have any data. This is due to an incorrect design decision when choosing the distribution key for the table.
So, what does distribution look like? In the image below, you can see that the data skew has reduced to 0.52% after changing the distribution key.

Summary
To summarize, you have seen a critical query that will help you identify data skew (which is not recommended) in your Azure Synapse Analytics Dedicated SQL Pools. This query will help you select optimal distribution keys for each one of the tables when the information is hash distributed.
Check out these other blog posts

Microsoft Fabric SQL Databases
Learn about Microsoft Fabric SQL Databases, a highly transactional database offering leveraging the Azure SQL Database engine. Discover their features, benefits, use cases, and step-by-step instructions to enable and use SQL Databases in Microsoft Fabric.

Preparing for 2024: Top 2 Strategic Focus Areas for Q4 2023
Are you ready to kickstart 2024? As Q4 2023 approaches and companies enter a code freeze, it’s crucial to focus on strategic priorities. Explore why maximising ROI in tech investments and leveraging Large Language Models can be game-changers for your business. Learn actionable insights for adopting these key focus areas and staying competitive.


1 Response
Denis
28 . 01 . 2023Hi,
Problem :
There’s an issue. Your query result contains duplicates rows. Real row count x 2!
Reason :
sys.dm_pdw_nodes cointain 2 rows : CONTROL, COMPUTE.
> JOIN sys.dm_pdw_nodes pn ON nt.[pdw_node_id] = pn.[pdw_node_id]
Solution:
in WHERE clause, add:
and pn.[type]=’COMPUTE’