With Azure Synapse Analytics you can create Power BI reports. Both technologies are integrated into the same workspace experience.
Today, we are going to demonstrate how it’s possible to create Power BI reports in Azure Synapse Analytics Workspace in order to decrease the time that it takes to get actionable insights.
Table of Contents
Add Power BI linked service in Azure Synapse Analytics
Azure Synapse Analytics connects to your Power BI workspaces when you create a linked service. You need to specify which workspace you want to connect to Azure Synapse Analytics.
In Azure Synapse Analytics, we can create a linked service using the following options:
- Home page
- Azure Synapse Analytics Manage Hub (click to know more about the Manage Hub)
Home page
When you open your Azure Synapse Analytics workspace, you will find the option to create a linked service.

Manage Hub

Configure Power BI Linked Service

You can see the linked service in the list:

You can fnd the Power BI section in your Develop Hub.

Any report available in the workspace is accessible from Azure Synapse Analytics.

Create Power BI dataset
In Azure Synapse Analytics, you get read-only access to the datasets in your Power BI workspace. You will need to create datasets by using Power BI Desktop or Power BI service.
You can also create reports inside Azure Synapse Analytics.
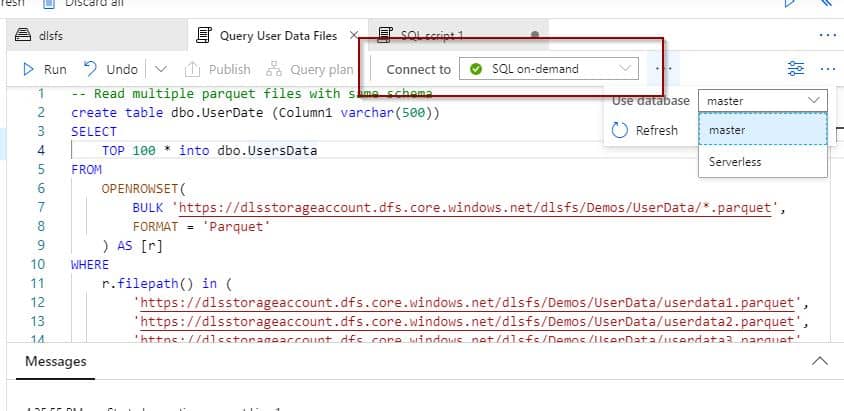
Azure Synapse Analytics allows you to download the Power BI Data Source file (.pbids extension) with the connection to your SQL pools configured.

You can download the Power BI Data Source file by clicking on New Power BI dataset.
Select the SQL pool that you want to use for your Power BI Report. In my upcoming posts, we will discuss the cost benefits of using the two technologies together.

Finally, download the Power BI file.

When you open the Power BI file, you will see that the connection is already configured. This is the main benefit of using Power BI Data Source files. You can just select the connection method (Direct Query or Import) and the tables from the SQL pool that you want to use for the report.

Then, you can work directly in Power BI Desktop if you’d like to modify the Power BI dataset by adding relationships and measures. When your Power BI dataset is ready, you can easily publish it to the same workspace where you connected the Power BI linked service in Azure Synapse Analytics.

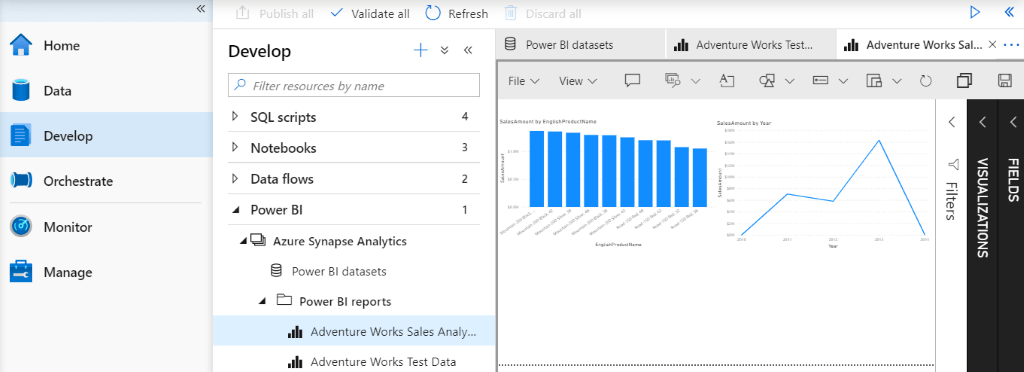
Build Power BI Reports in Azure Synapse Analytics
Once you publish the Power BI dataset, you are ready to build reports in Azure Synapse Analytics workspaces.
Select your Power BI dataset and create a report or use the Develop Hub options to create it.


You will see a new Power BI Report in the workspace.


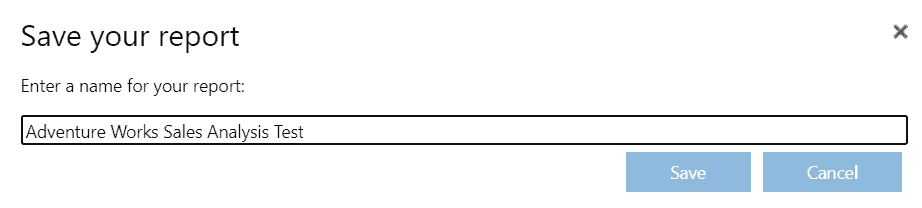
Next, save the report and rename it.

Consume Power BI Report
After you save the report, it will be available in Azure Synapse Analytics and your Power BI workspace in Power BI Service.
Azure Synapse Analytics

Power BI Service


Summary
Integrating Power BI into any product is always a good idea, but with Azure Synapse Analytics the time it takes to reach actionable insights decreases significantly. It’s great to see how the two technologies come together. Such an integration has a lot of potential.
What’s Next?
Up next I will cover the cost benefits of using Power BI and Azure Synapse Analytics together.