Combine Power BI and Azure Synapse Analytics Serverless to get timely actionable insights. In this blog post, you will create a Power BI report using the on-demand form of Azure Synapse Analytics. Get the best performance from the engine and pay only per usage!
In my previous post on Power BI and Azure Synapse Analytics, I highlighted how easy it is to build Power BI reports in Azure Synapse Analytics workspaces.
In the previous post, I used a provisioned database. Today, we’ll explore the serverless (on-demand) offering and connect to it using Power BI.
Table of Contents
The tutorial below has three sections:
- Create External Tables
- Create Power BI dataset
- Create Power BI report
Why should you query the information in a Data Lake using Azure Synapse Analytics external tables and not directly Power BI?
I believe that are two key reasons for doing this:
- Power BI only supports import mode when using information from your Data Lake. This means that you have limitations on the size of the dataset (either Power BI Pro or Power BI Premium). Import mode also makes it difficult to display recent or near real-time changes.
- Using the engine of Azure Synapse Analytics will bring great performance and big data capabilities to your reporting solutions, and it is fully integrated with your Azure data lake store.
Pre-requirements
For this example, we are going to be using 2 different AdventureWorks parquet files that you can download from this link.
- Sales_SalesOrderHeader_20200723.parquet
- Sales_SalesTerritory_20200723.parquet
Create external tables
First, create external tables in your Azure Synapse Analytics SQL serverless pool. You can create them without writing any lines of codes.
Since Azure Synapse Analytics on-demand does not store any data in the database, we’ll create a link definition between your Data Lake and the database. This takes advantage of the Synapse Analytics engine (Massively parallel processing system).
Create external table Sales Order Header

Azure Synapse Analytics can create the external table for us. We just need to provide the name of the database that we want to use (serverless is the default option), external table name, and the automatic option.

Then, you’ll be able to query the information.

Create external table Territories
Now, repeat the same process for the territories file.

Territory file external table.

You can verify that the objects exist in your database by using the Data Hub.

Create Power BI dataset
Next, to create a Power BI report, you need to have a linked service (check this blog post on how to create a Power BI report) and create the datasets (connected to your serverless external tables).

This screen starts the tutorial.

First, select your database.

Now, it’s time to download the Power BI template. This allows you to create a dataset.

After that, open the report and select your datasets.

In our scenario, we are going to use the direct query method that doesn’t require importing information into a Power BI report.

Make sure that you create a relationship using the Territory Id column.

We’ll build the report in Azure Synapse Analytics, so you can simply publish the dataset.

Select the Azure Synapse Analytics workspace that you are using in your linked service.

The dataset will become available in your Azure Synapse Analytics workspace, but you still need to configure the dataset credentials.

Configure the credentials for the Power BI dataset in the Power BI service.

Next, edit the credentials.

And finally, select the authentication method to OAuth2.

Your dataset is ready!

Create a Power BI Report
Now that you have external tables and a Power BI dataset; you can start building reports using the Direct Query method to your Data Lake parquet files.

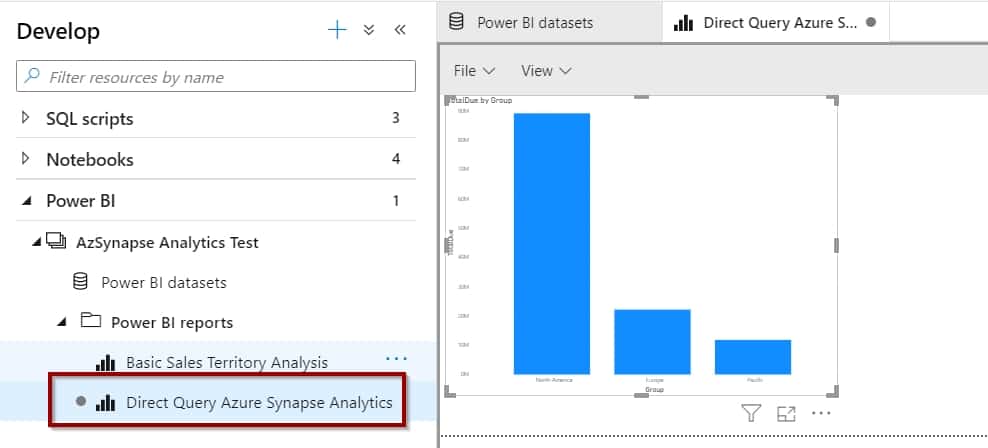
Select your dataset.
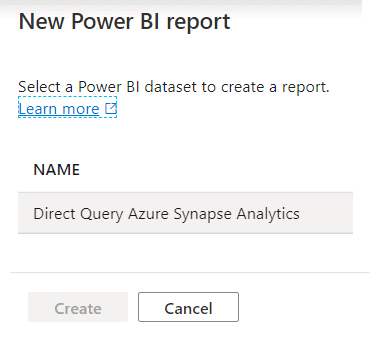
Now, you are ready to start creating Power BI Reports!

When you save the report, it will become available in your workspace. You can also share it.


It will be available in Azure Synapse Analytics as well.

Summary
You’ve seen how easy it is to create external tables and Power BI reports in Azure Synapse Analytics using a serverless option (pay per usage).
Final Thoughts
I’m really satisfied with delivering actionable insights from end-to-end without writing a single line of code. This will certainly enable more users to start using the platform and get value out of it.
What’s next?
Looking ahead, I’ll be posting on some of the other features within Azure Synapse Analytics. Please leave a comment if there is anything that you would like to learn about.