


If you want to extract Power BI Objects with Azure Data Factory or Synapse Analytics – including workspaces, reports, datasets that have been deployed to your Power BI tenant – don’t look any further. Create or download the solution here.
Table of Contents
How do you govern what you cannot see?
To begin, simply you can’t. I frequently run into scenarios where a Team is assigned an activity to govern a Power BI tenant. Power BI does not offer great capabilities for monitoring the current state of your tenant in detail.
How many workspaces, reports, datasets, have been deployed? Who has access to which workspace?
It would be great to have these answers as part of the Power BI tenant admin portal, but until these capabilities are available, you need to export the information from your Power BI tenant.
With services like Azure Purview, you can mitigate some challenges. However, it does not cover aspects like users and access.
There are a few key components when governing Power BI:
- Define the operating model, roles, principles, policies, standards, and processes
- Extract Power BI objects to understand the current tenant state (this blog post)
- Monitor user behavior (Power BI activity logs)
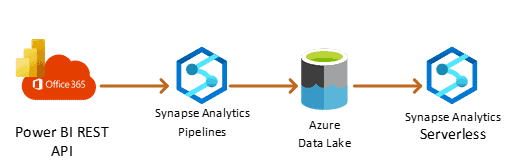
The solution below uses the new set of admin REST APIs and only queries the Workspaces endpoints (GET https://api.powerbi.com/v1.0/myorg/admin/groups) it exports:
- Power BI Workspaces
- Power BI Reports
- Power BI datasets
- Power BI dataflows
- Power BI Workbooks
- Power BI users and their access to the workspaces
By only using this endpoint, you can optimise the ongoing cost of the solution because you just need to query the API and execute the copy activity once.
Pre-requirements (Access)
First things first, you need to give your Azure Data Factory or Azure Synapse Analytics managed identity access to use Power BI REST APIs. You also need to grant access to your Azure Data Lake if exporting the data to that service.
Power BI Access (Source)
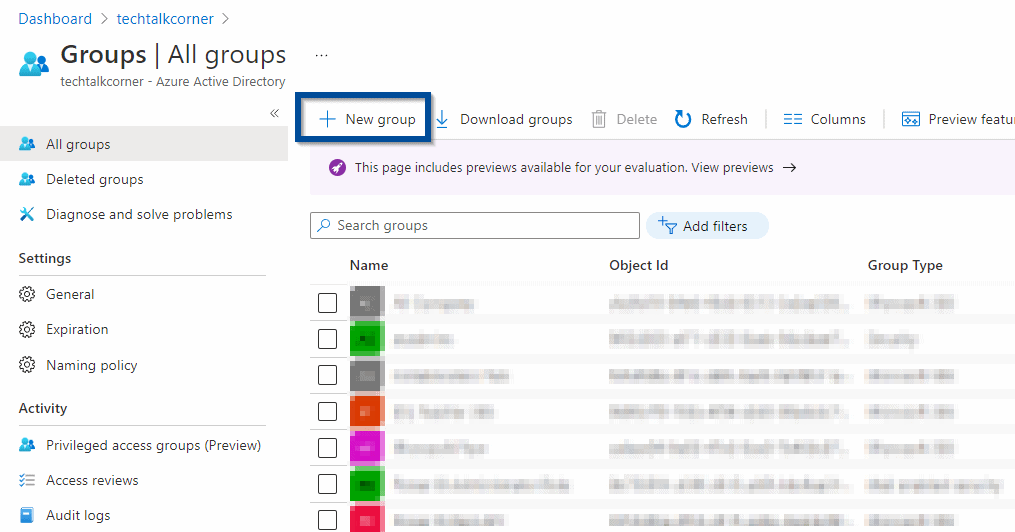
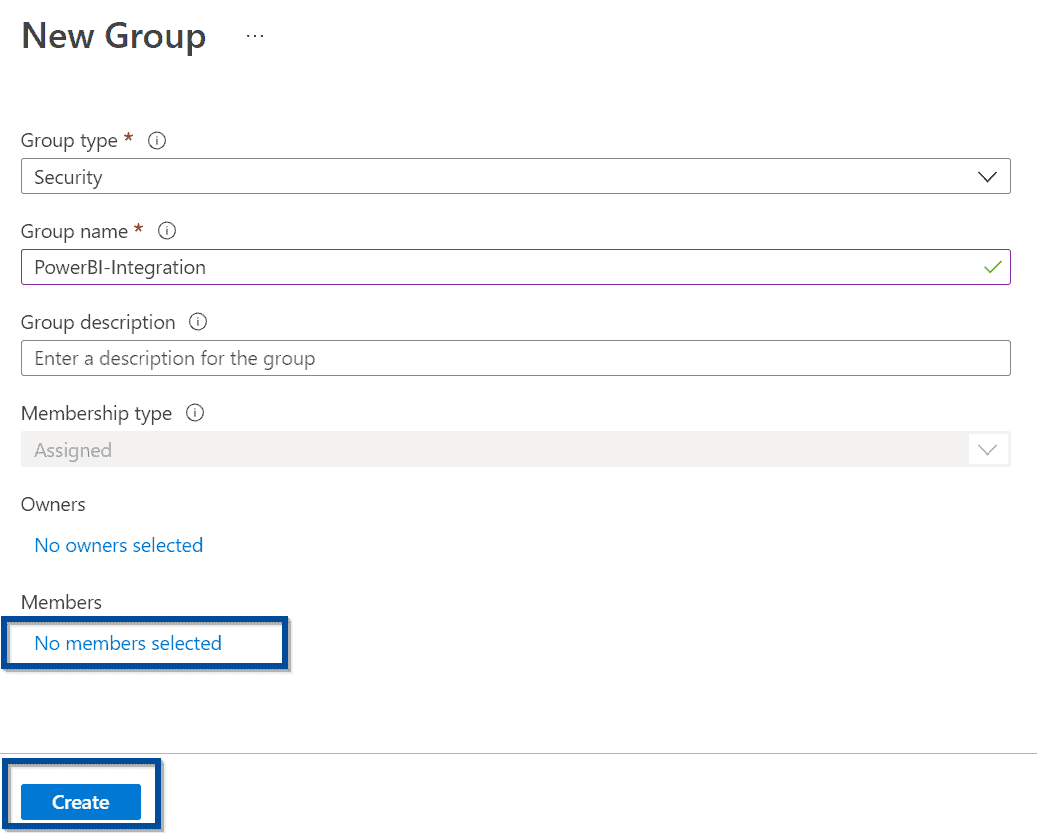
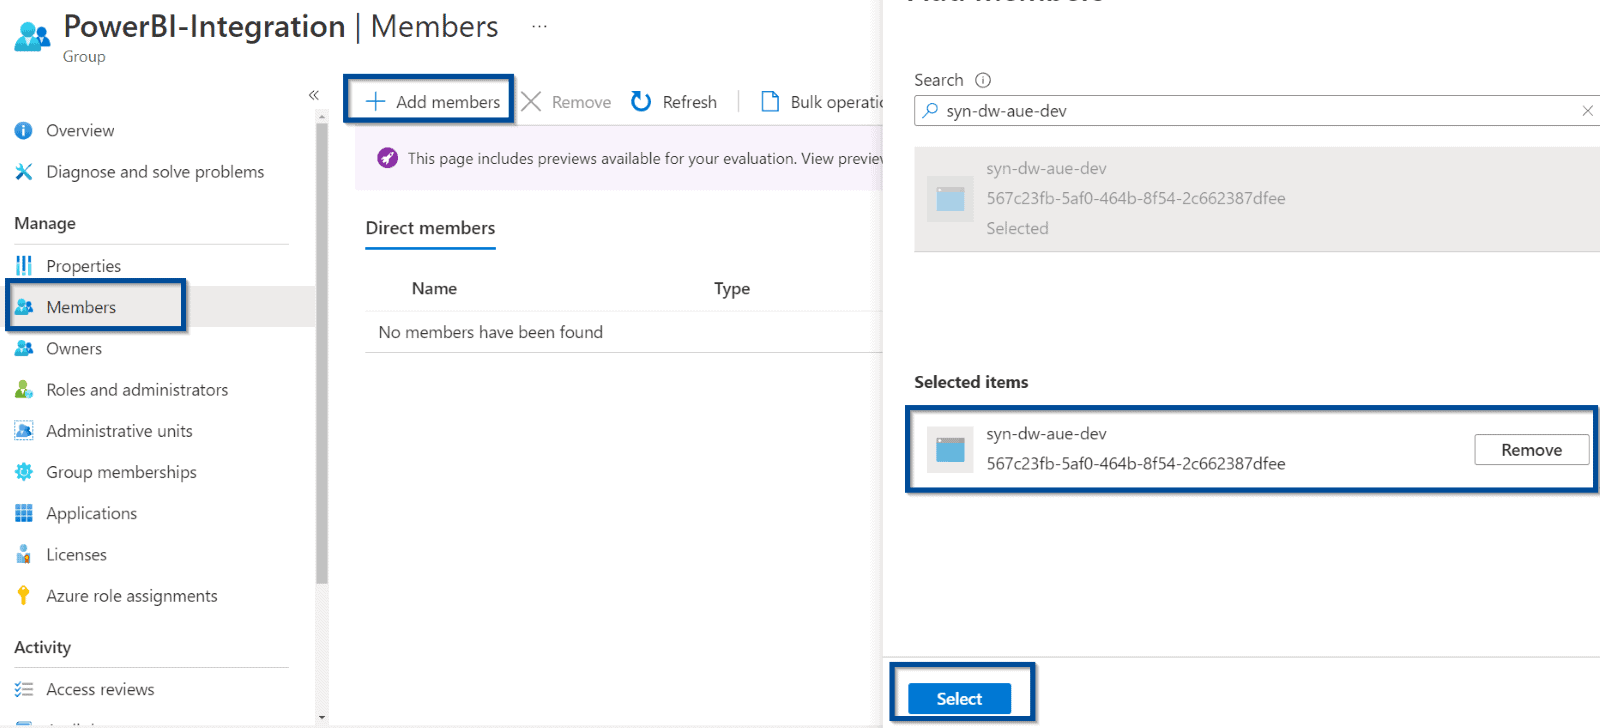
In Azure Active Directory, create a group so you can add your Azure Data Factory or Azure Synapse Analytics managed identities to that group.
The group is used to grant access to Power BI REST APIs.
You can add members when creating an Azure Active Directory group.
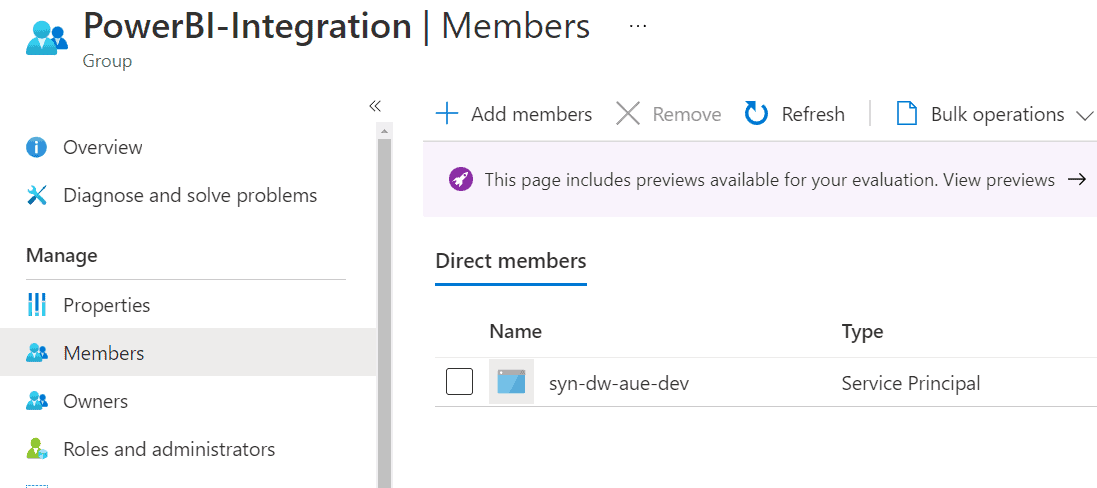
Next, find your Azure Synapse Analytics or Azure Data Factory services and add them as part of the group.
The membership for your Azure Active Directory group should appear as described below.
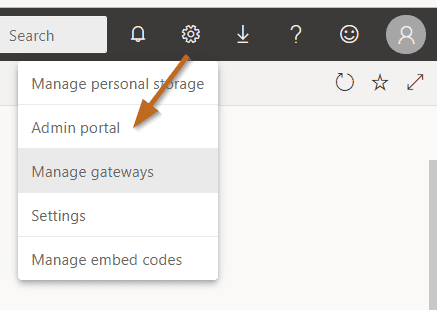
In Power BI (you need admin access), navigate to the admin portal.
Finally, add the previously created group to the following configuration:
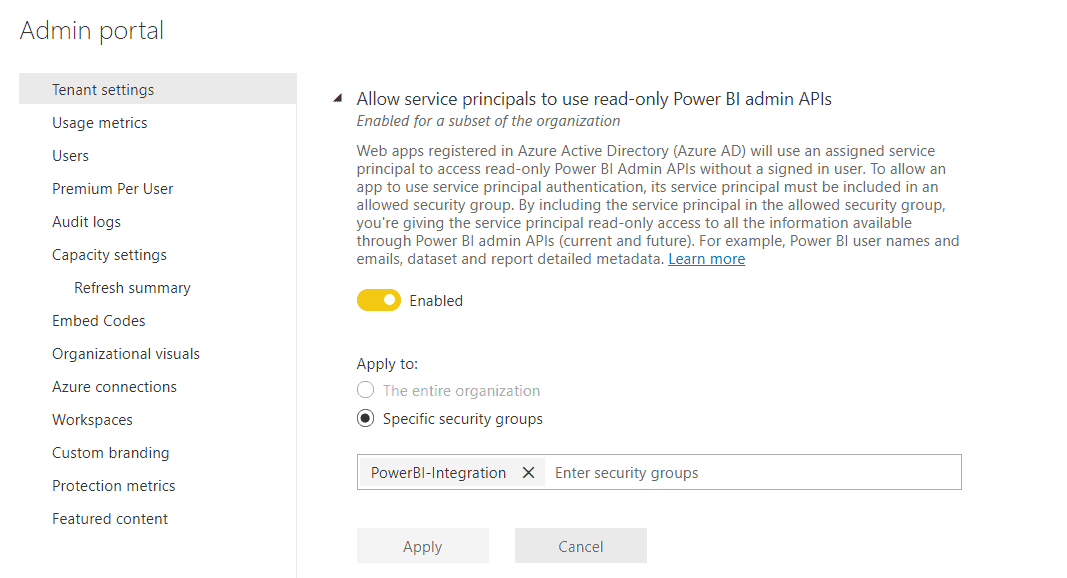
You have finished configuring access to Power BI!
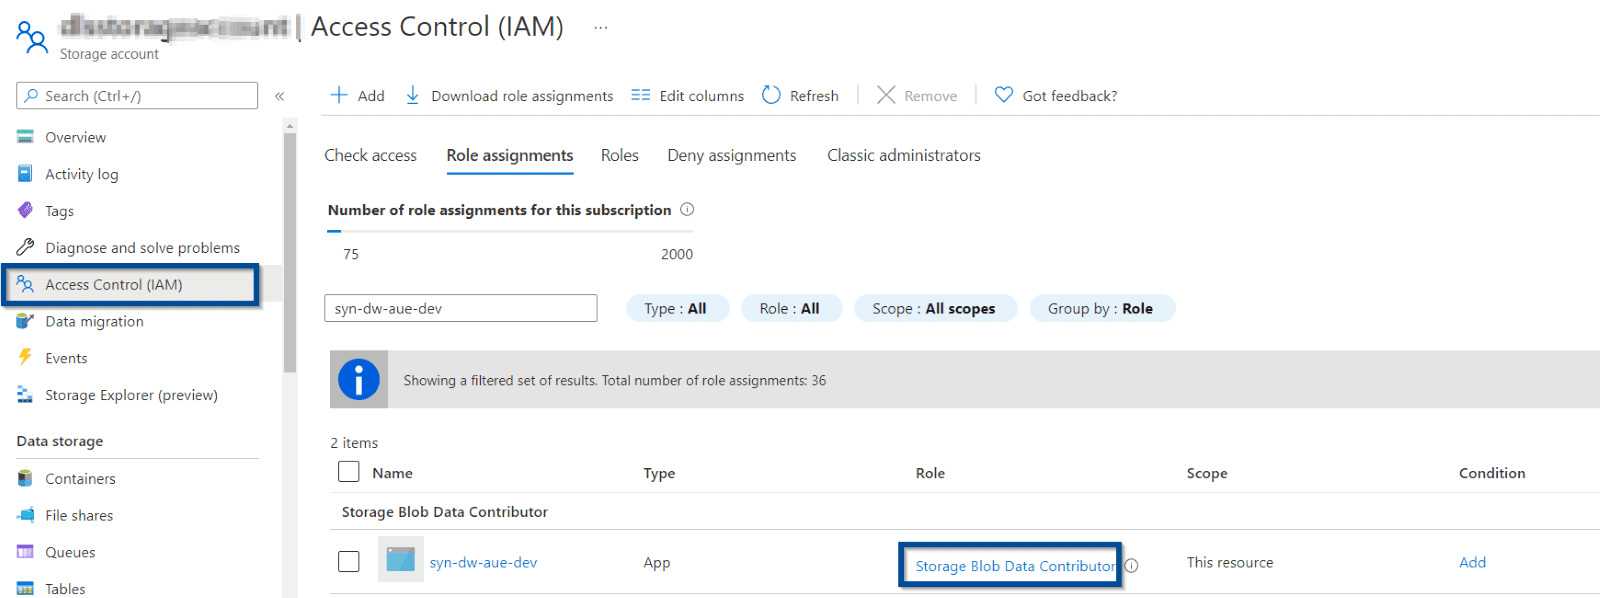
Azure Data Lake Access (Destination)
Now, make sure you give your Azure Data Factory or Azure Synapse Analytics access to Azure Data Lake.
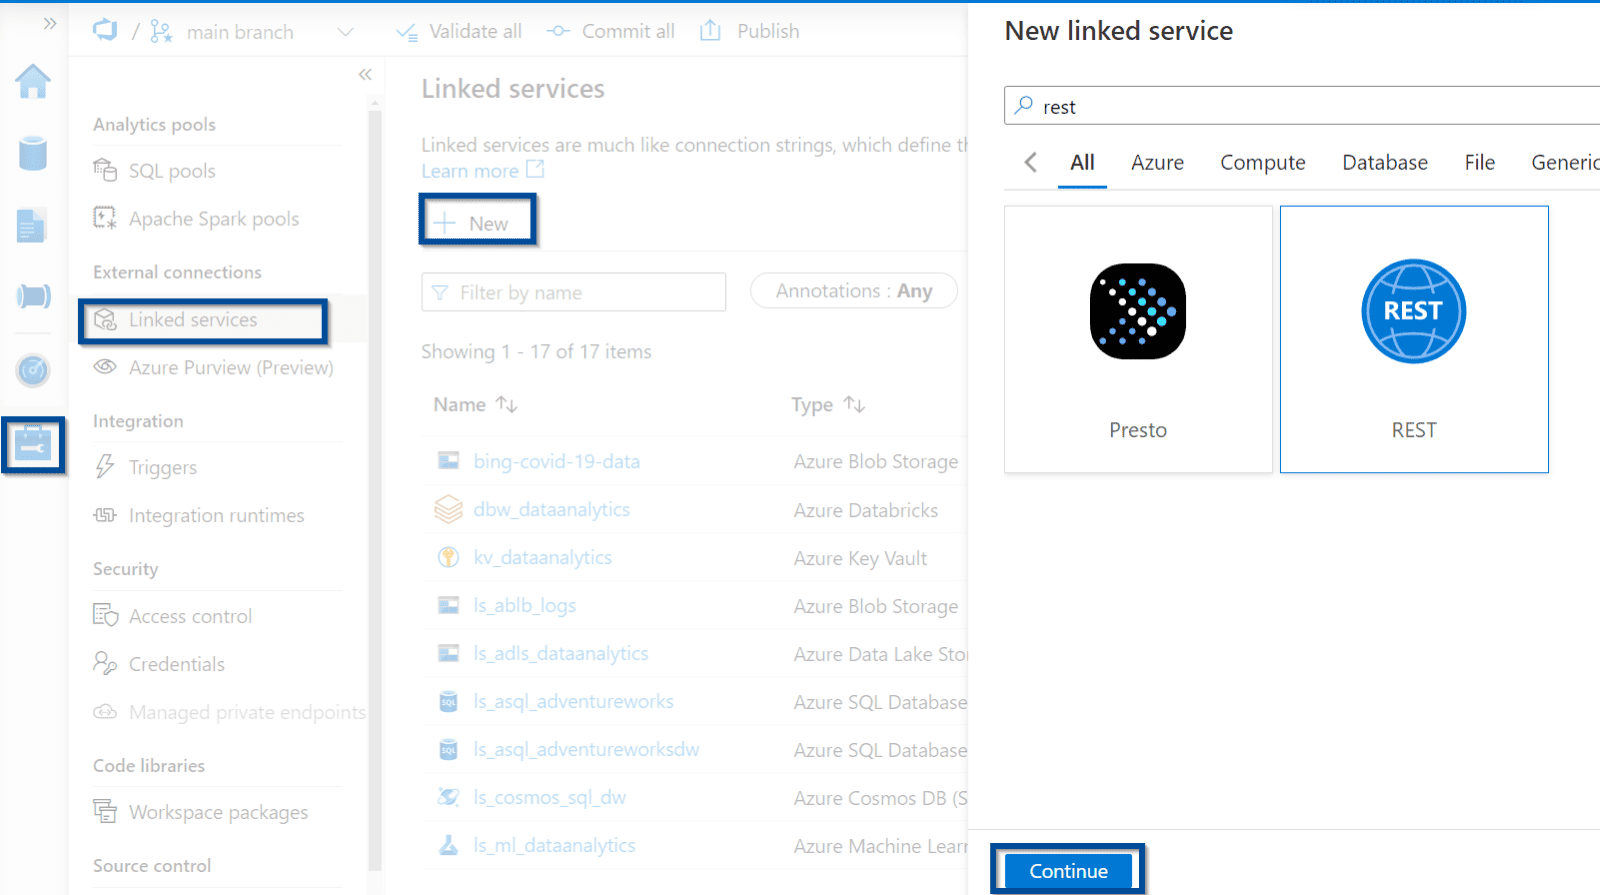
Create Linked Service for Power BI REST API (Source)
First, let’s created a linked service for Power BI REST API endpoints.
Navigate to the management hub and select the REST linked service connector.
Configure the linked service as follows:
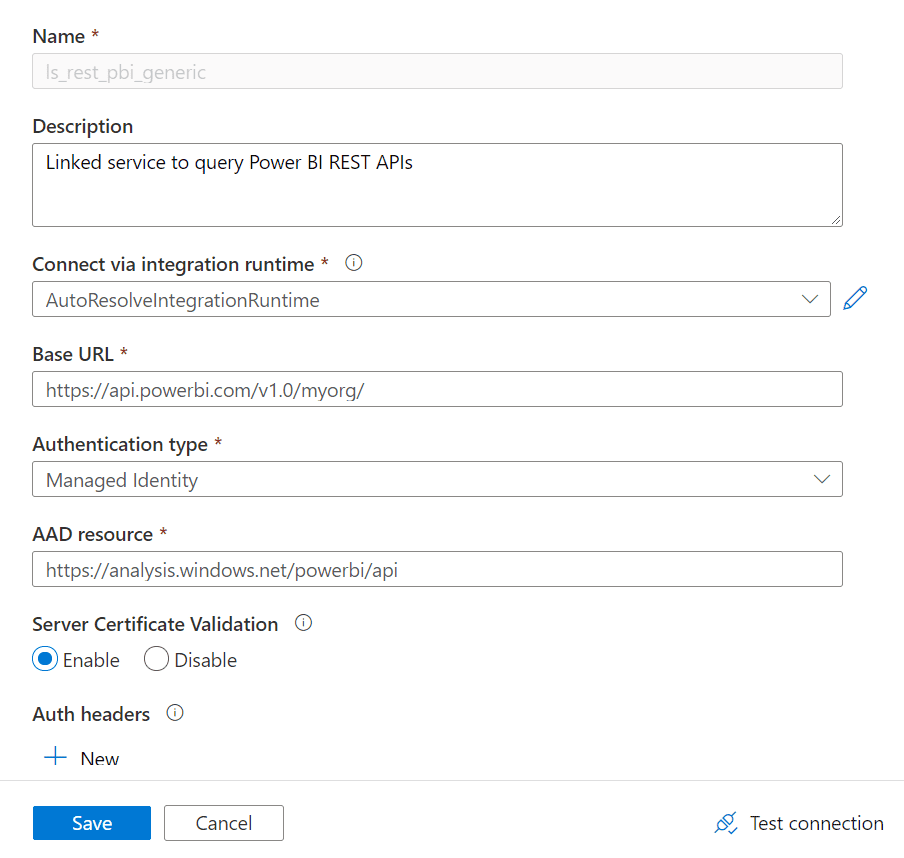
Base URL:
https://api.powerbi.com/v1.0/myorg/
AAD Resource:
https://analysis.windows.net/powerbi/api
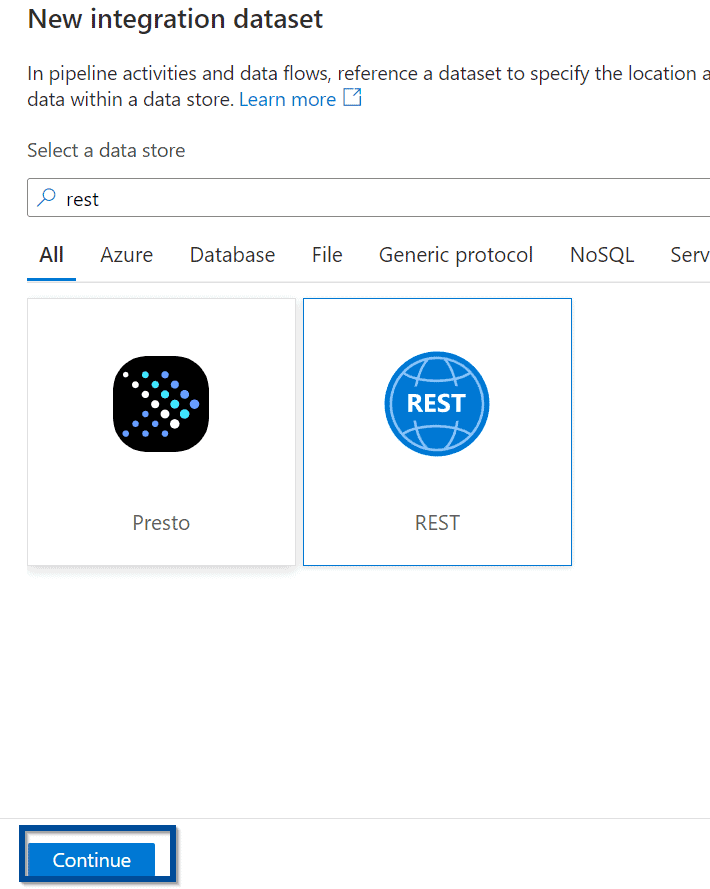
Create a Dataset for Power BI REST API
Let’s create a dataset that you can use across all your Power BI REST API calls in Azure Data Factory or Synapse Analytics.
This is the source dataset in the copy activity.

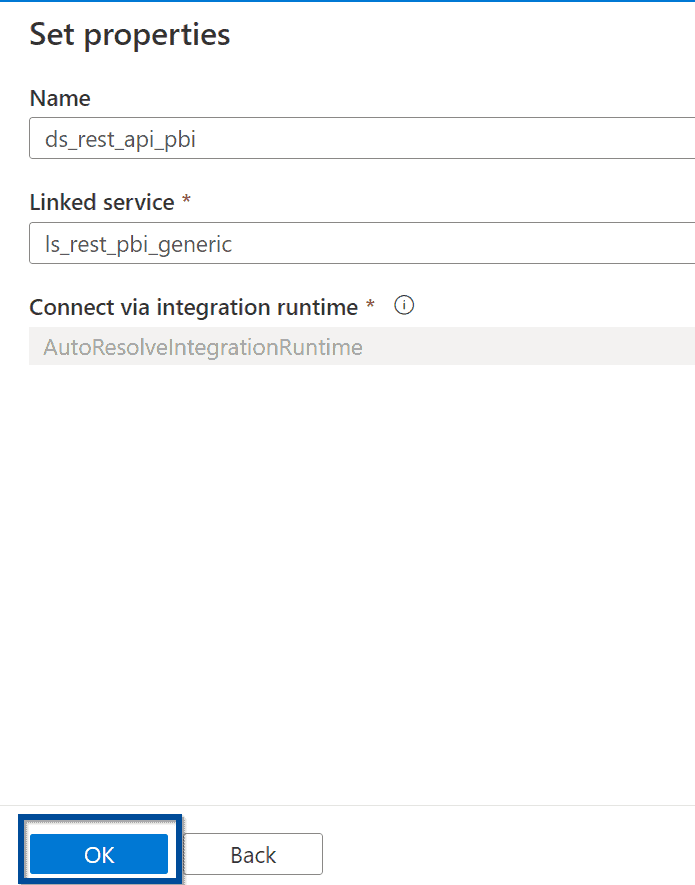
Select the REST dataset type.
Define the name of the Power BI REST API dataset.
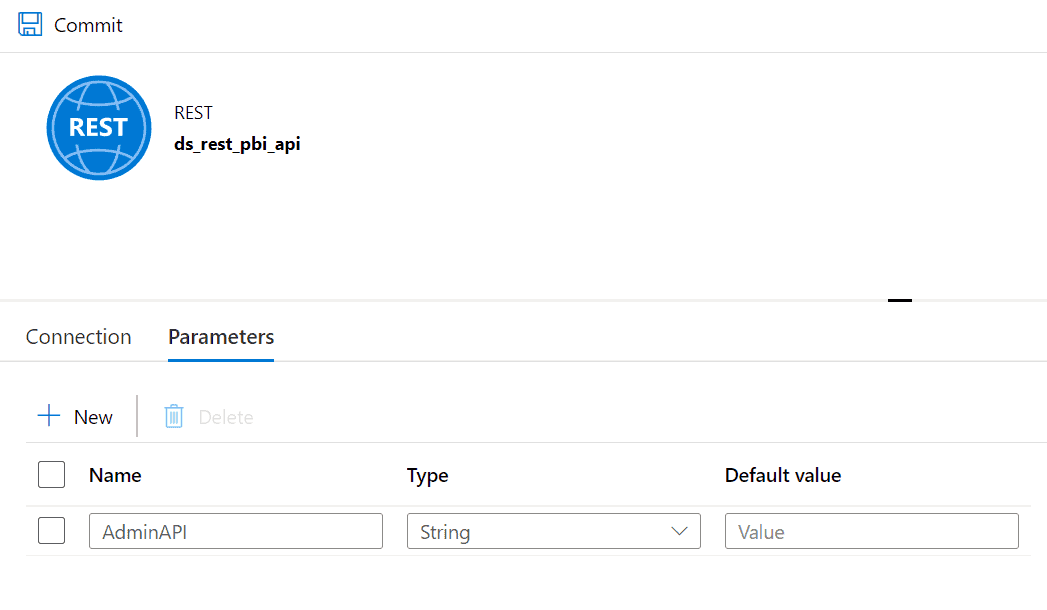
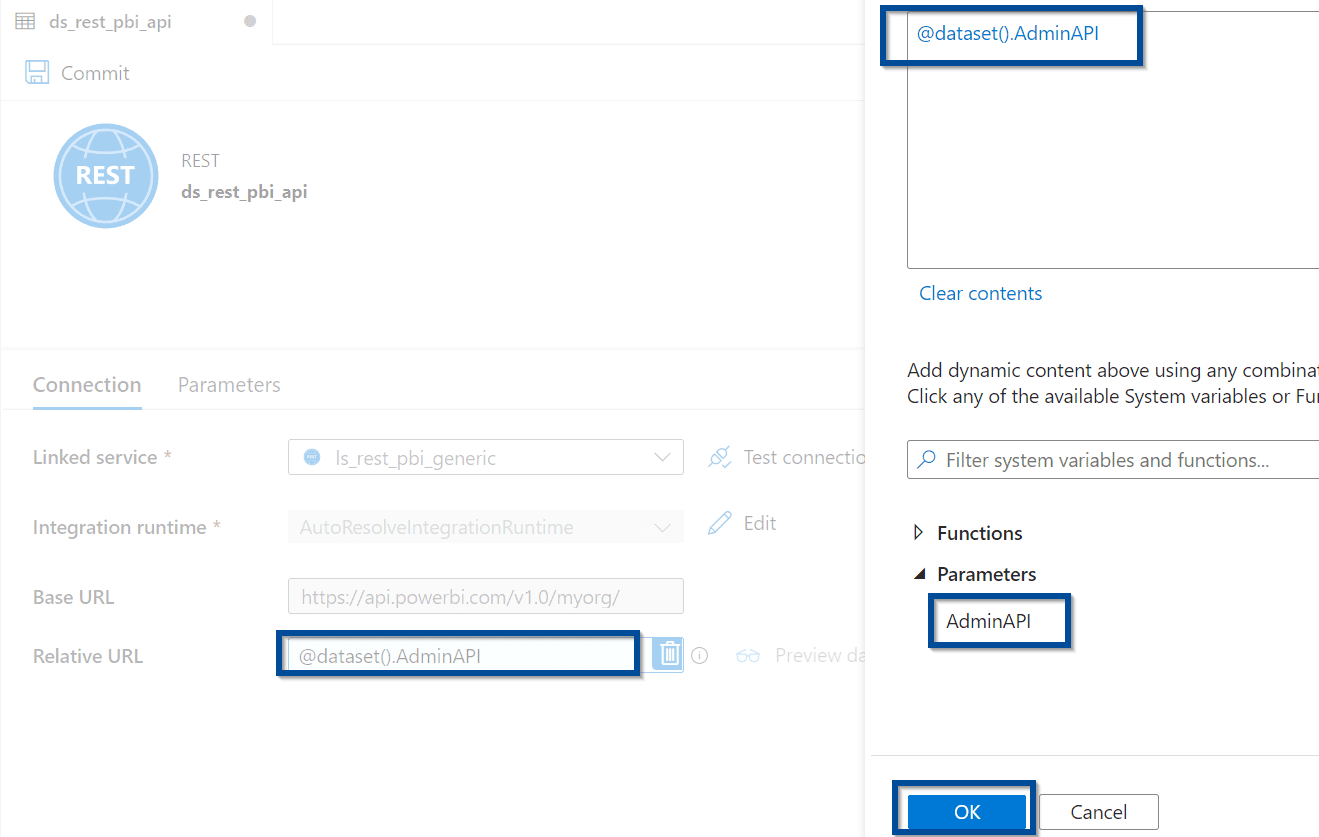
Create a parameter in the dataset that gives you some flexibility when trying to query different Power BI REST API endpoints.
Download the Solution to Extract Power BI Objects with Azure Data Factory or Synapse Analytics
You can download the solution to extract Power BI objects with Azure Data Factory or Synapse Analytics from my repository here.
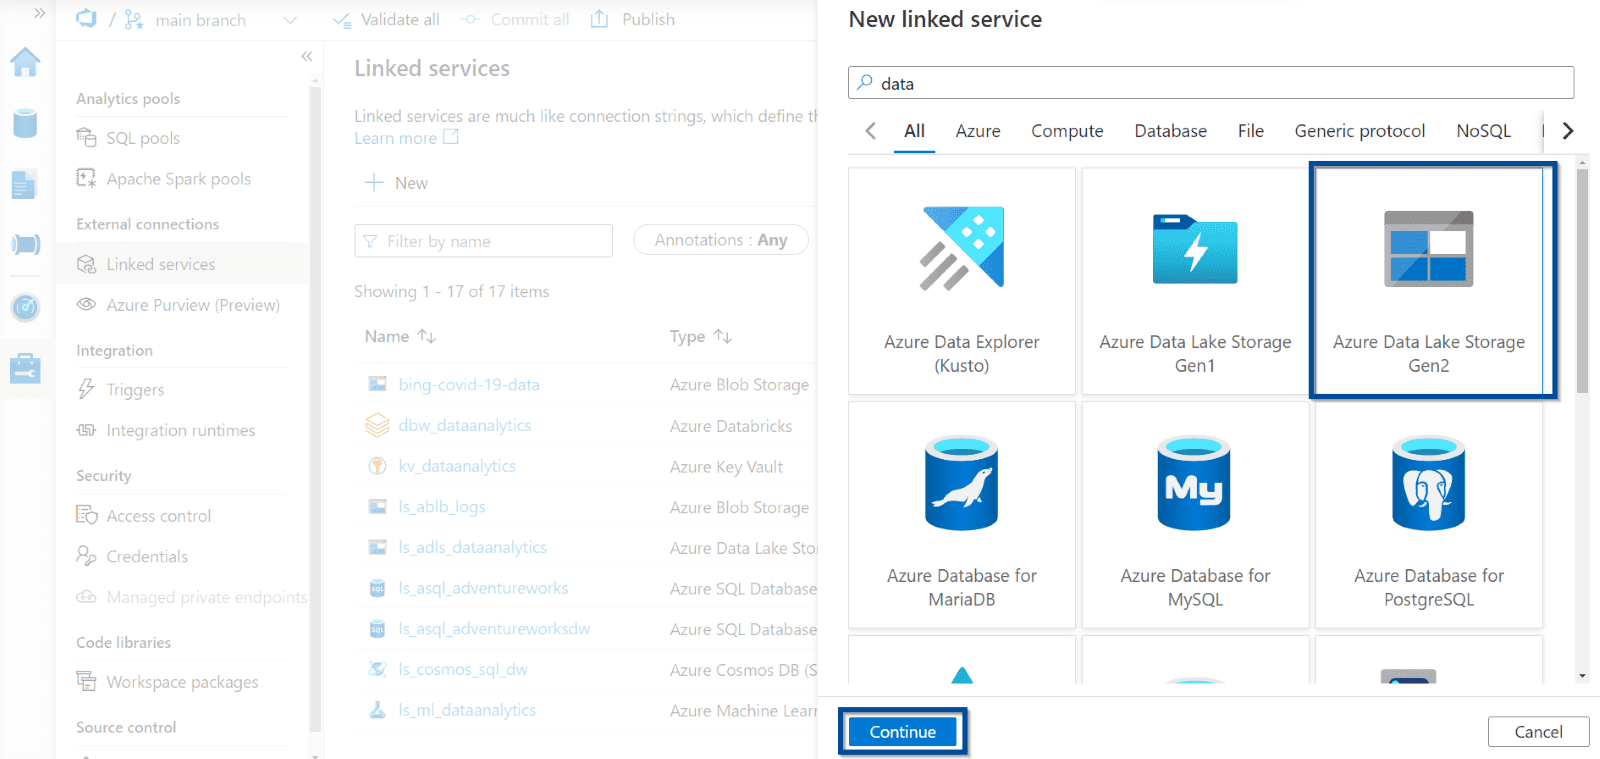
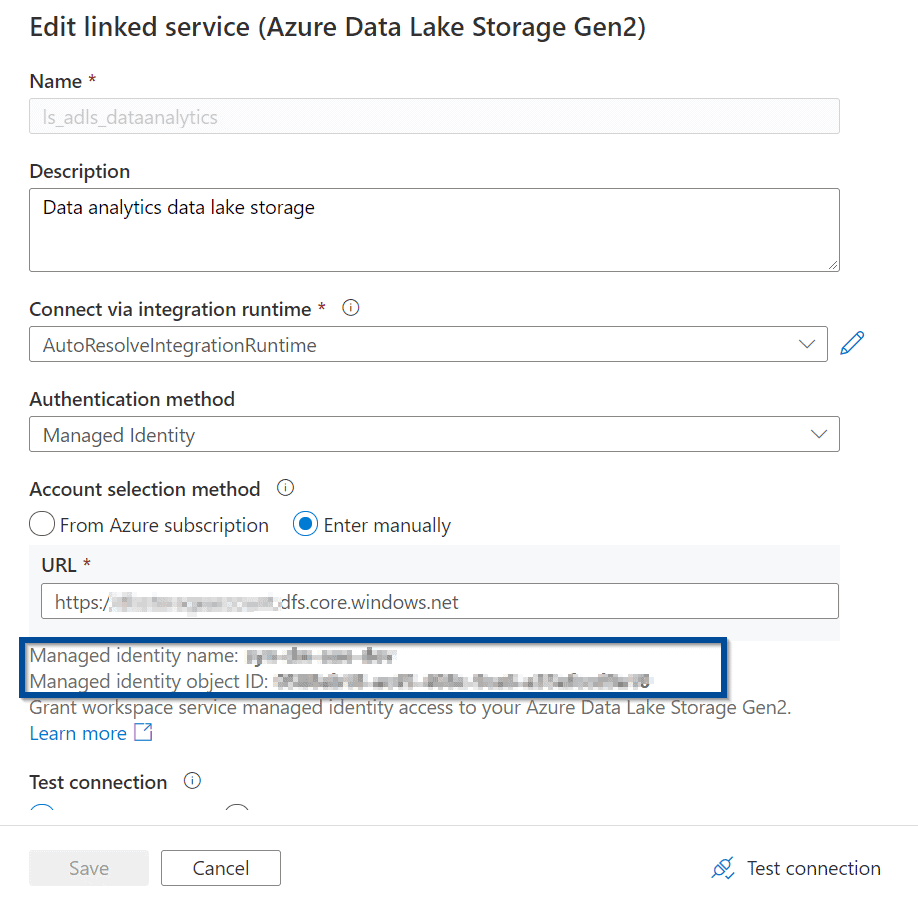
Create Linked Service for Azure Data Lake (Destination)
Let’s create the Linked Service for your Azure Data Lake. First, define a different destination like Azure Synapse SQL Pool or Azure SQL Database.
In the case of Azure Data Lake, configure the linked service as follows:
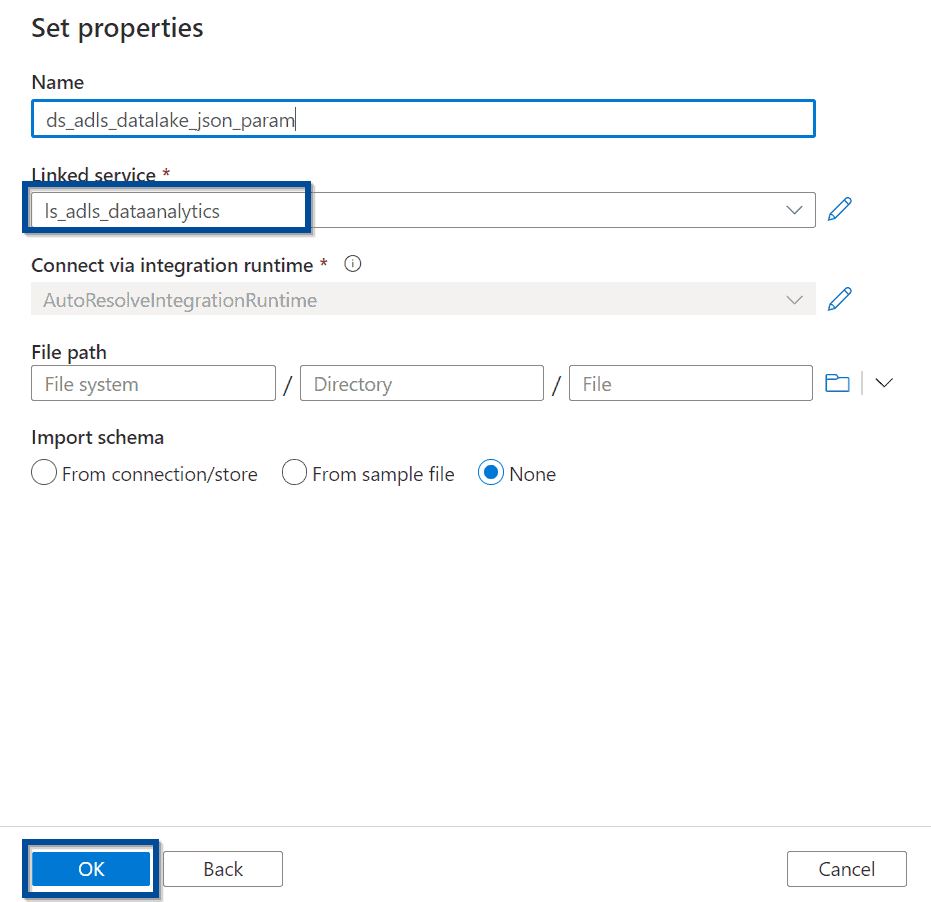
Create a Dataset for Azure Data Lake
Next, create the destination dataset of your copy activity.
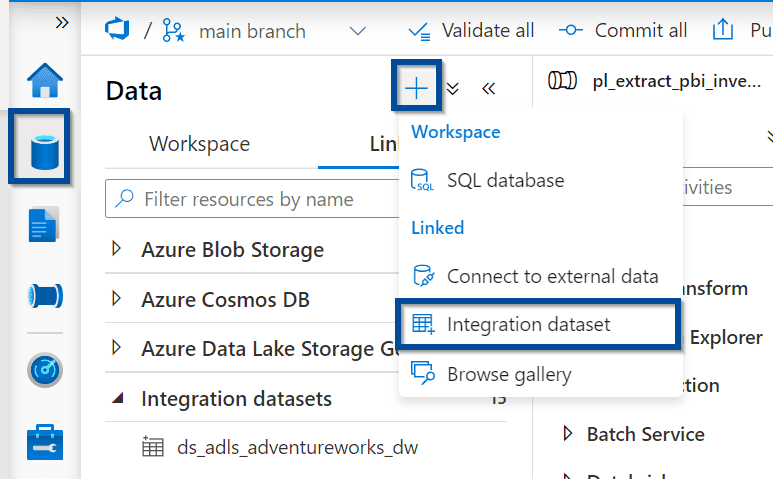
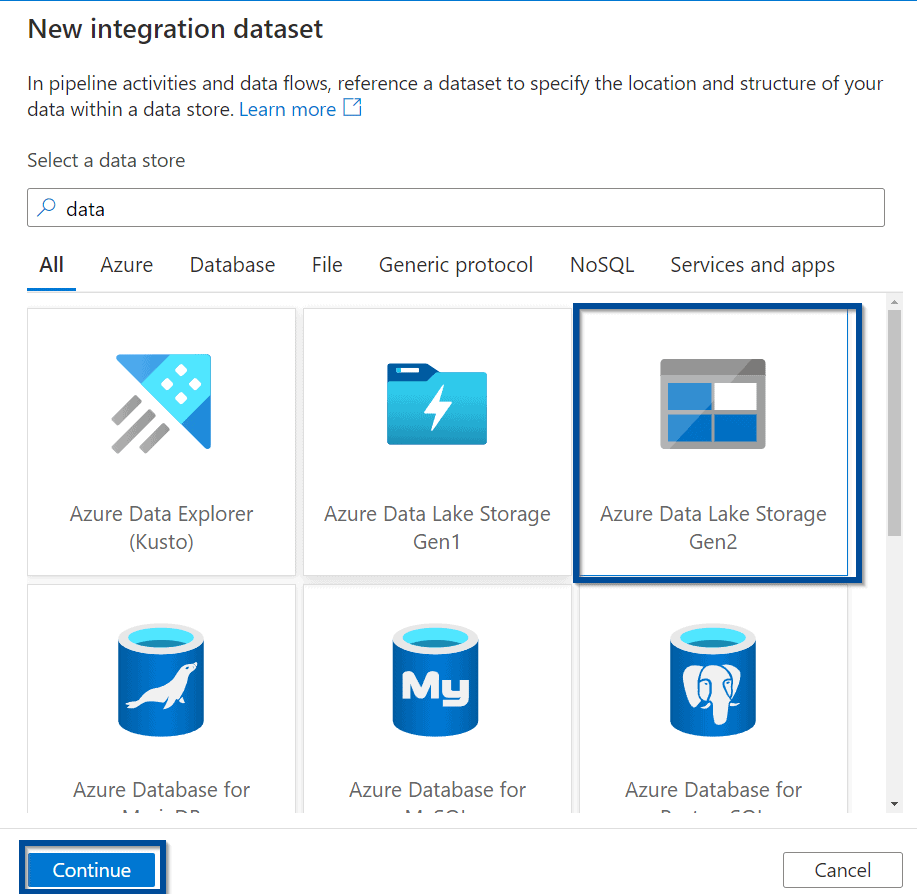
Select the Azure Data Lake dataset type.
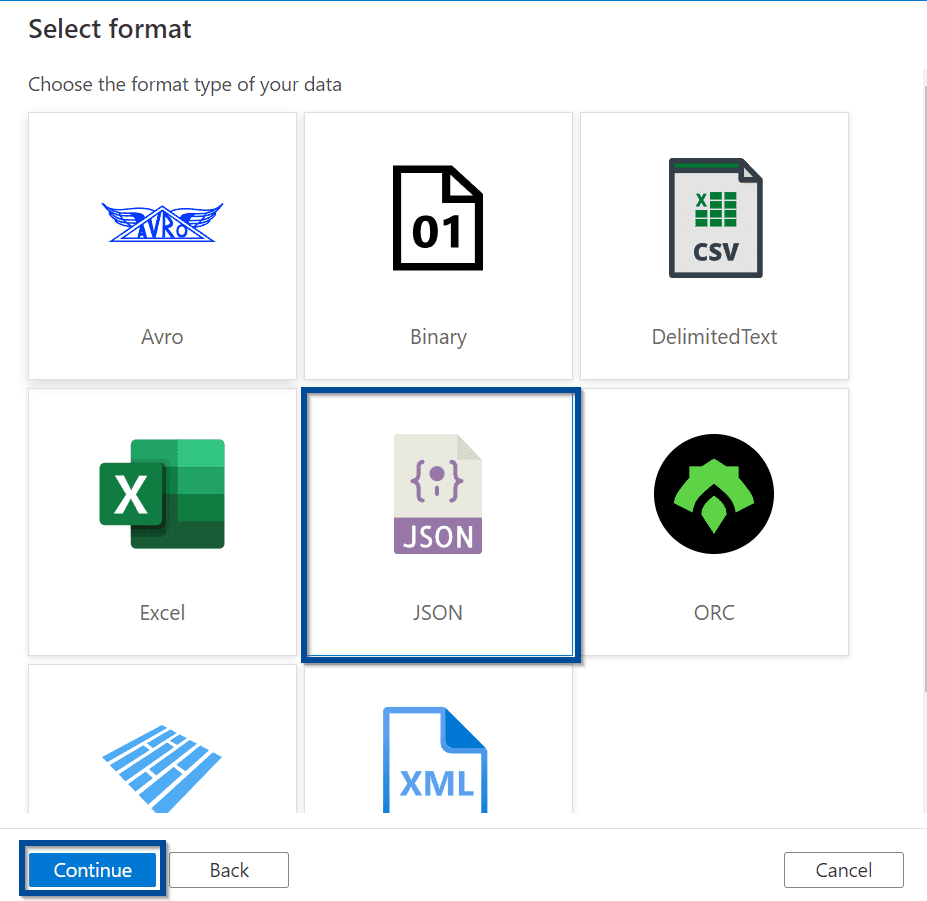
And in this case, the format type needs to be JSON as that’s the response that you will get from the Power BI REST API endpoints.
Select the previously created linked service for your Azure Data Lake.
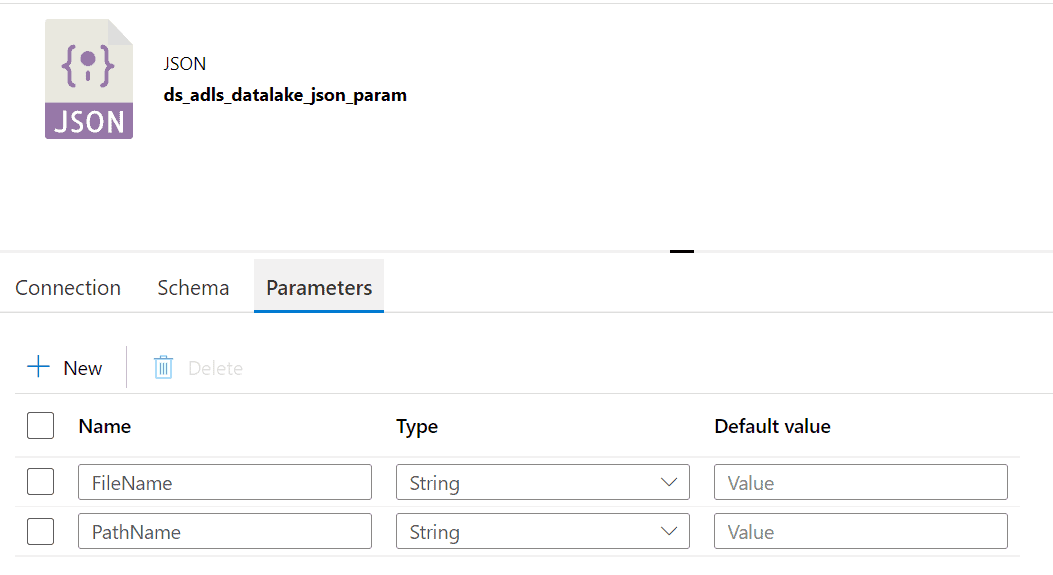
Create 2 parameters in the Azure Data Lake dataset:
- FileName
- PathName
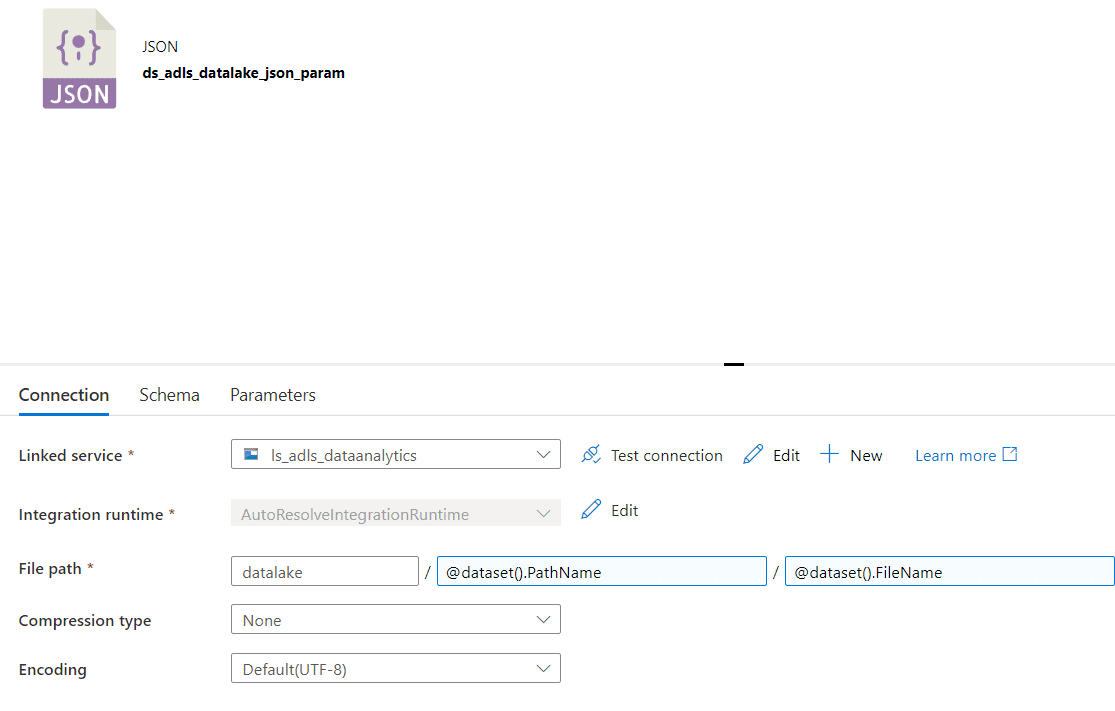
Now, include the parameters as part of the File path in the Connection section of your dataset.
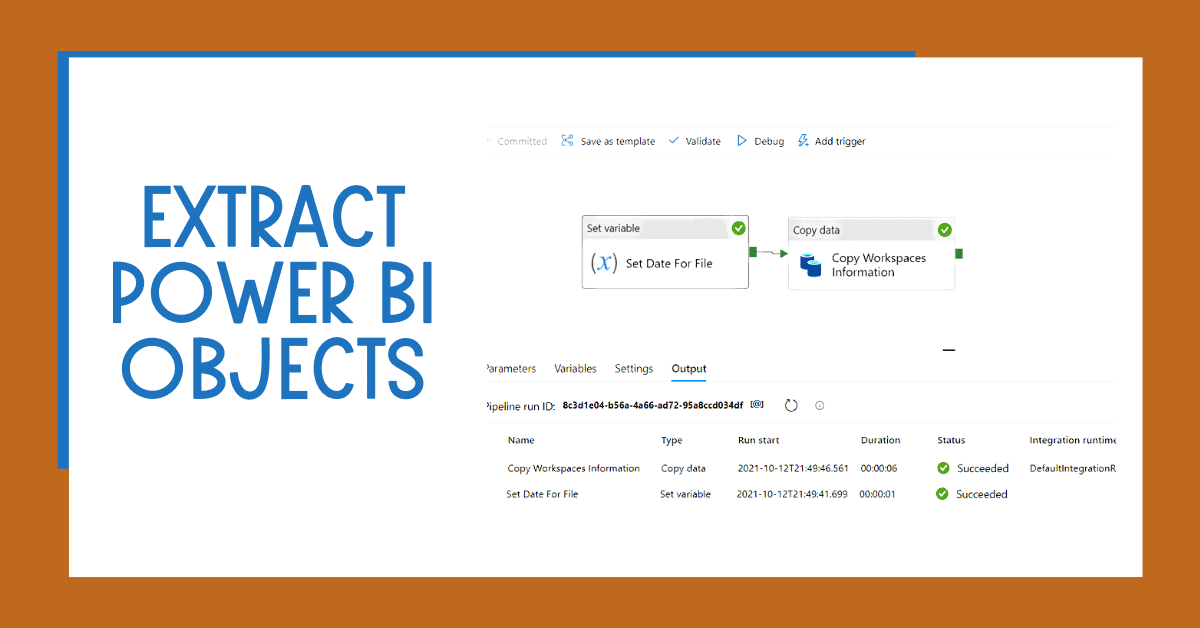
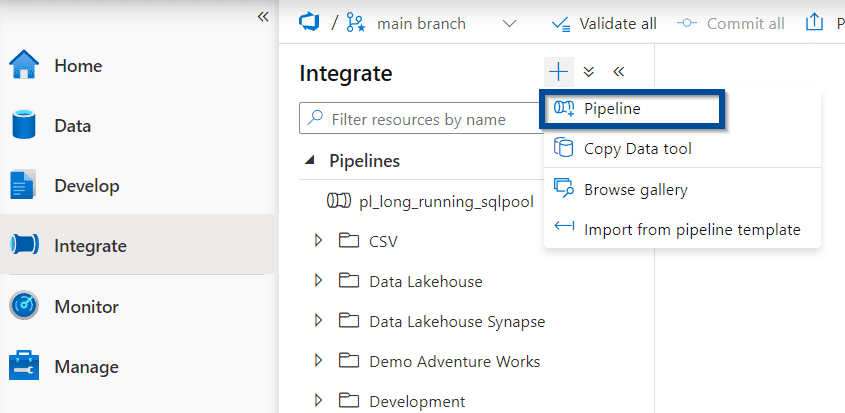
Create a Pipeline to Extract Power BI Objects with Azure Data Factory or Synapse Analytics
Finally, let’s create a pipeline that performs exports of Power BI objects into Azure Data Lake.
Azure Data Factory or Azure Synapse Analytics pipelines export Power BI workspace information using the REST APIs to a file in your Data Lake.
Define a name for your pipeline that will extract information from Power BI.
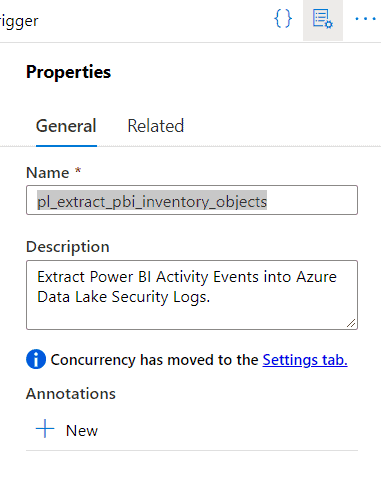
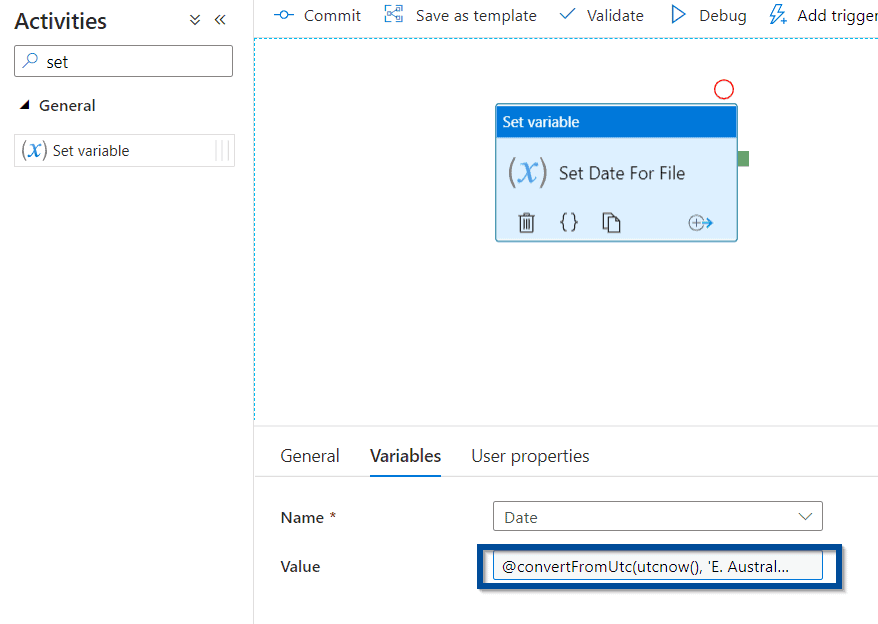
Set Variable Activity
First, add a “Set variable” activity. This helps you add a date to the final dataset to identify when the information has been exported from your Power BI tenant.
For the value of the variable, add the following code:
You can see more time zones here.
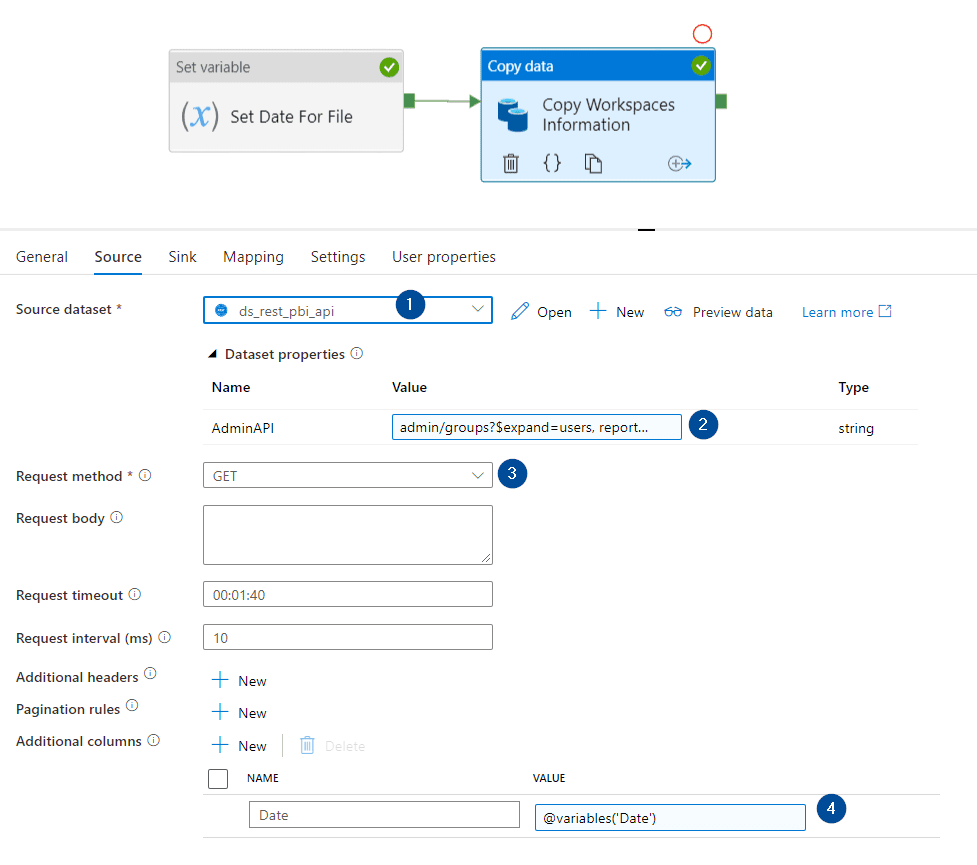
Copy Activity
Finally, add a copy activity that is the glue for your datasets and linked services.
In the source section:
- Select the Power BI REST API dataset previously created
- Method: GET
- Include the following value for the parameter
admin/groups?$expand=users, reports, dashboards, datasets, dataflows, workbooks&$filter=(state ne ‘Deleted’)&$top=500
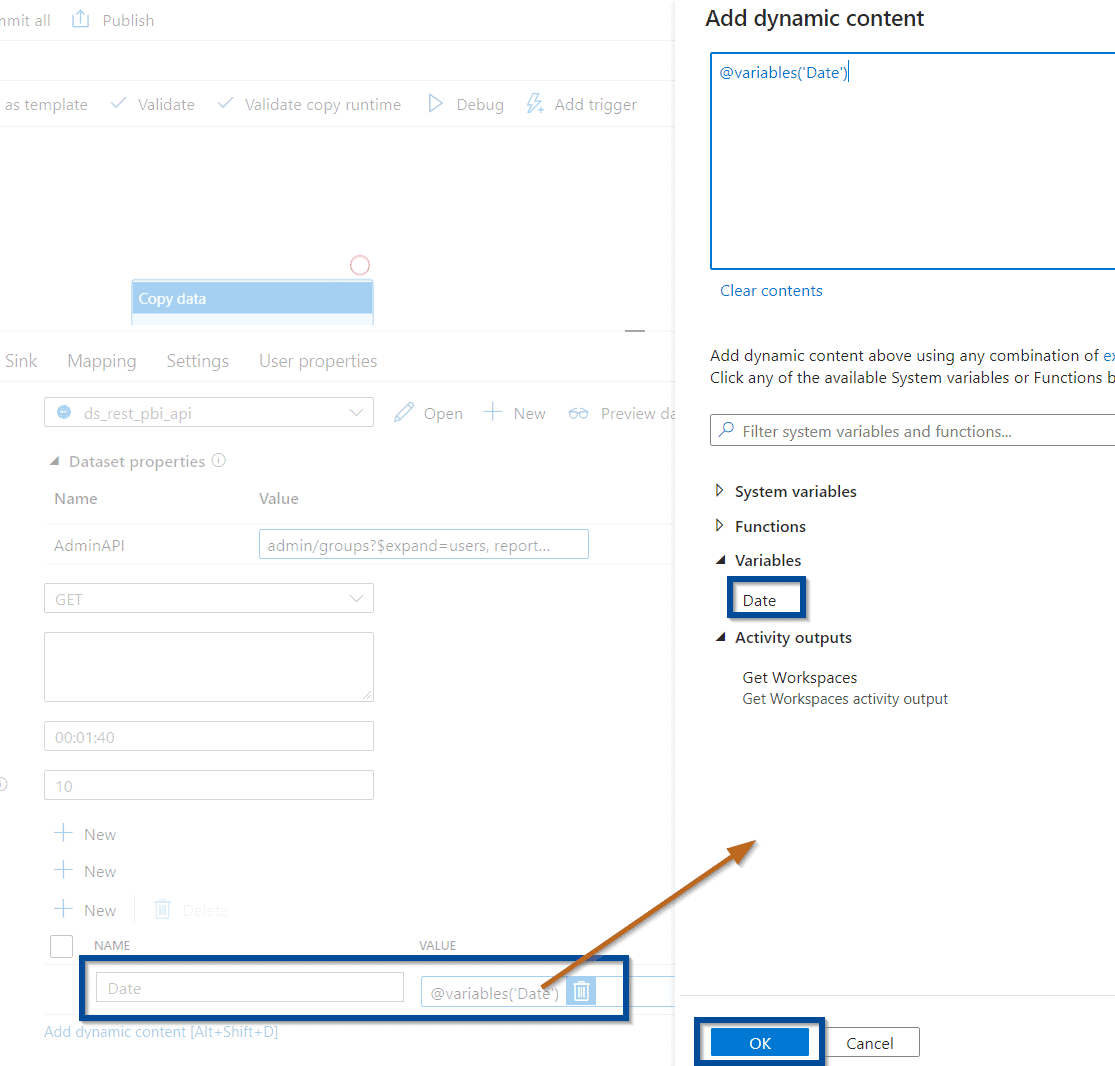
- Add an additional column for the date
The query above gives you a lot of flexibility.
You can see that you are filtering by specific state by excluding deleted workspaces using “state ne ‘Deleted’” or that you are listing only 500 workspaces by using “top=500”
You can also use any other Power BI REST API; I will explore this in upcoming blog posts.
For the additional column, use the following expression:
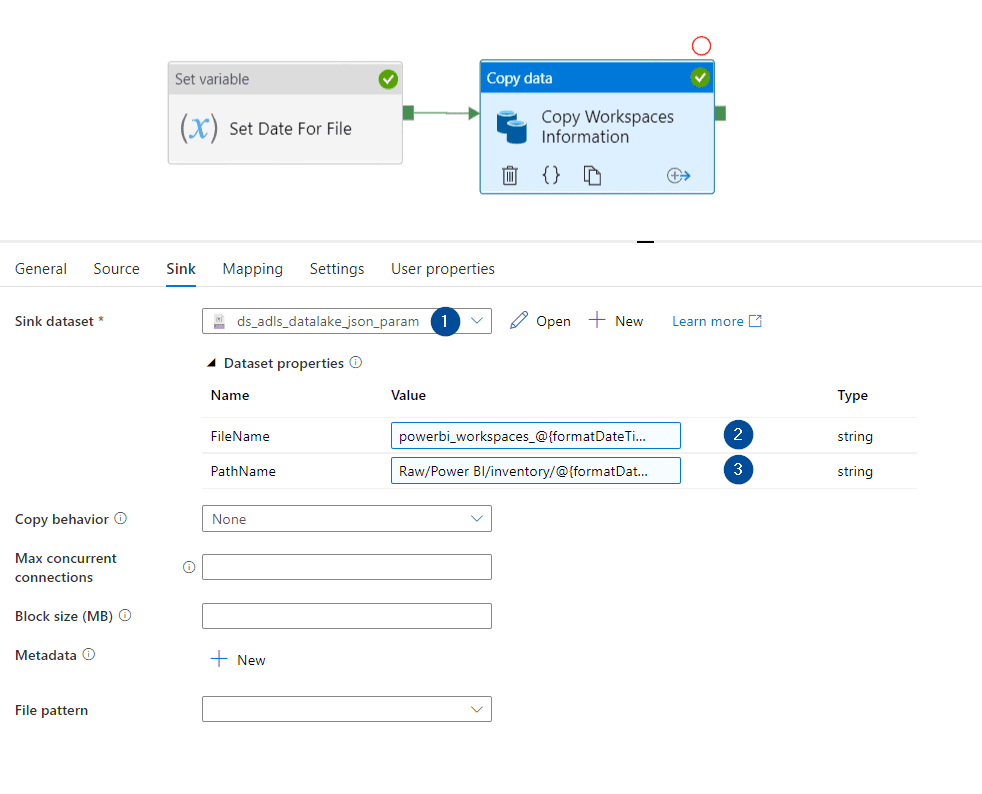
In the sink section, add the following configuration:
- Select the Azure Data Lake previously created
- File name parameter value:
- powerbi_workspaces_@{formatDateTime(variables(‘Date’), ‘yyyyMMdd’)}.json
- Path name parameter value:
- Raw/Power BI/inventory/@{formatDateTime(variables(‘Date’), ‘yyyy’)}/@{formatDateTime(variables(‘Date’), ‘MM’)}
You can modify the above values to define a different file path or name.
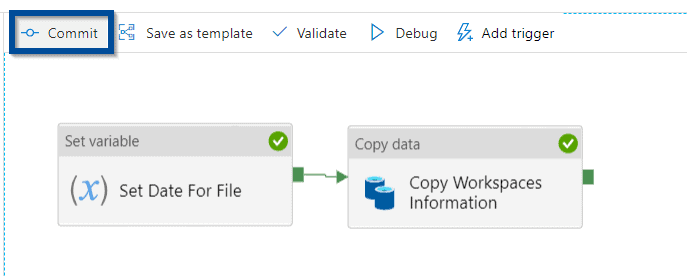
Let’s save the changes by committing them.
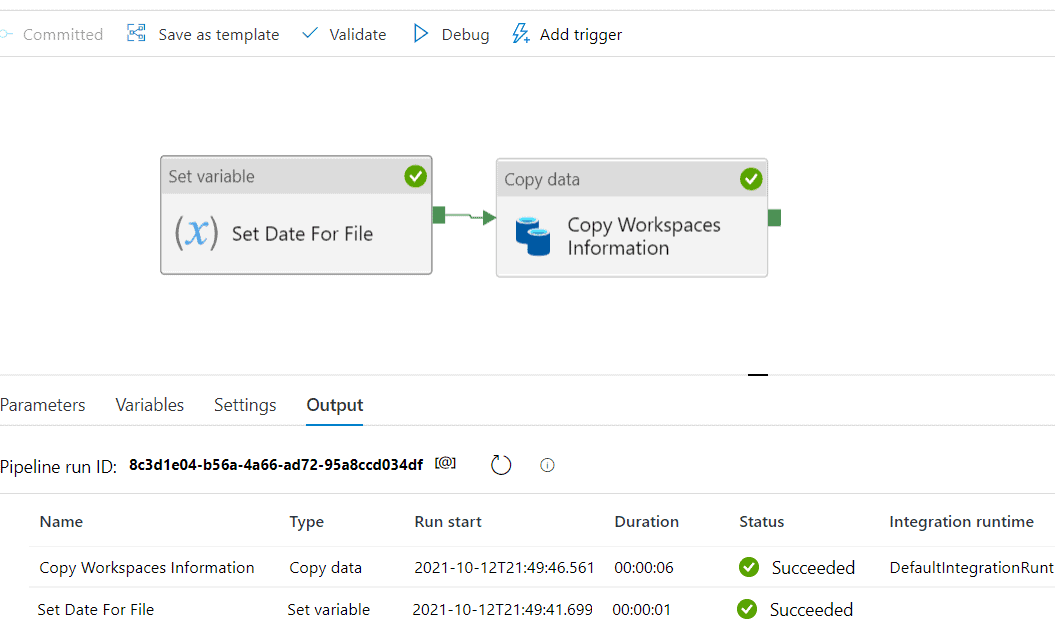
Execute Azure Data Factory or Azure Synapse Analytics Solution to Extract Power BI Inventory
You can now execute the pipeline or debug it.
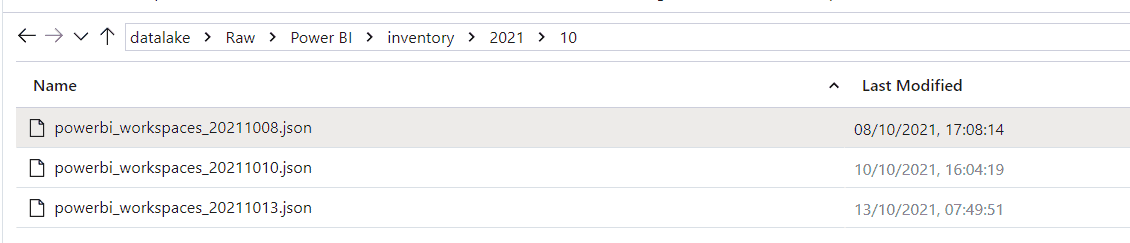
If you navigate to the Azure Data Lake folder, you can see the new files.
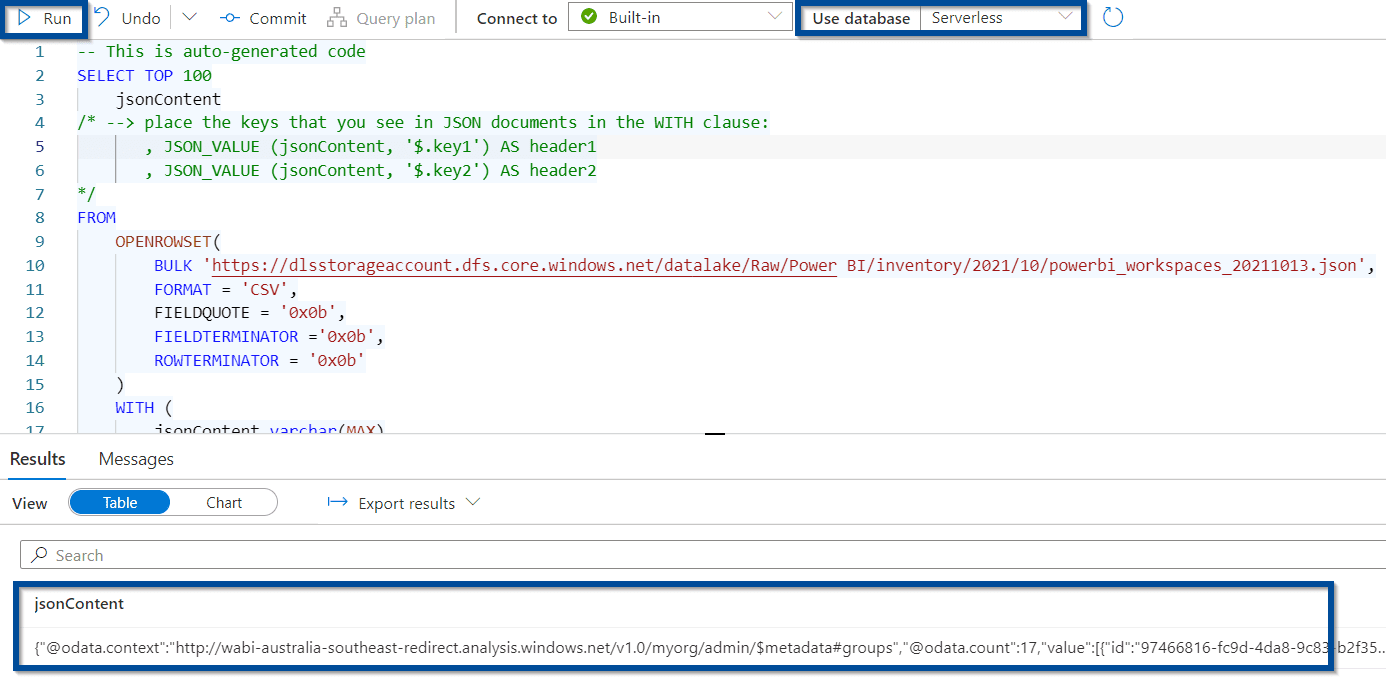
Next, take advantage of Azure Synapse Analytics to start analyzing the information.
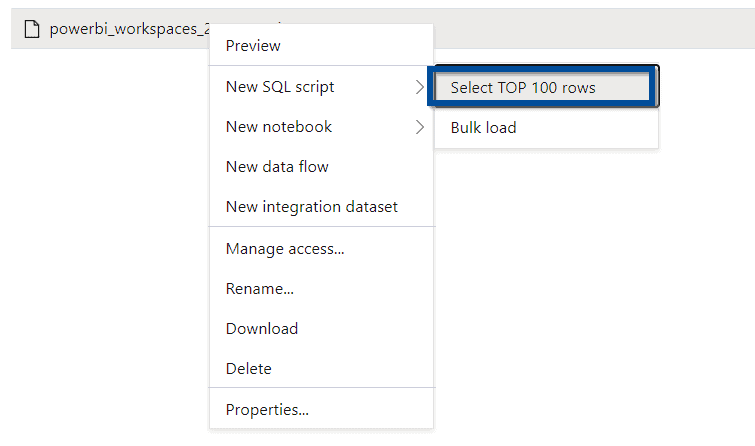
Using the serverless option, you can easily see the values returned.
Simply connect a Power BI report to the serverless SQL Pool to start querying information. Power BI is great when working with JSON values.
If you are hoping to capture information daily, you can publish the solution and schedule the pipeline with a trigger.
Summary
In summary, the return of investment by spending a few minutes building this solution is high. You can track user access and identify the number of objects across your Power BI tenant.
Start governing your Power BI tenant by extracting Power BI objects with Azure Data Factory or Synapse Analytics.
What’s Next?
In upcoming blog posts, we’ll continue to explore some of the features within Azure Data Services.
Please follow Tech Talk Corner on Twitter for blog updates, virtual presentations, and more!
If you have any questions, please leave a comment below!

3 Responses
Armand
19 . 04 . 2022How did you manage where there are more groups than the max allowed $top value, how would you set the pagination
Jake Burns
15 . 07 . 2022David, I have worked in BI for a while and I wanted to commend you on an excellent, clean solution here. Most of the articles are suggesting powershell and other code heavy approaches that are not nearly as simple as this. Nice work and thank you!
Bruce
18 . 03 . 2024Hi David, excellent job…now I want to extract refresh history from those copied datasets, how do I do that?