


Azure Synapse Analytics Studio Monitor Hub allows you to monitor your workspace pipeline orchestration, activities and SQL or Apache Spark resource usage.
Table of Contents
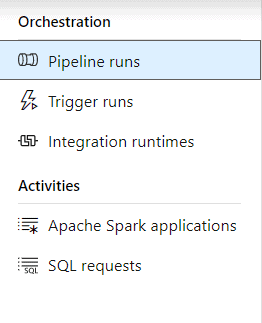
The Synapse Analytics Monitor Hub offers the following options:
Orchestration (same experience as in Azure Data Factory)
- Pipeline runs
- Trigger runs
- Integration runtimes
Activities
- Apache Spark applications
- SQL requests
All of the sections offer the option to apply filters and add or remove columns from results:
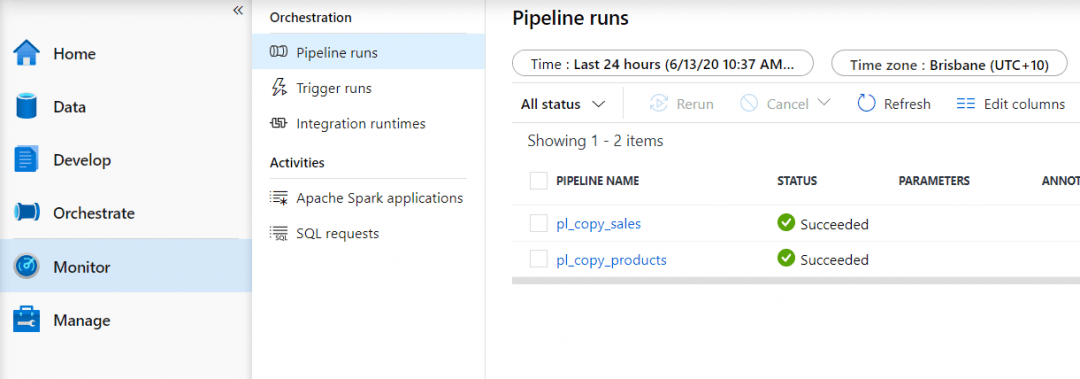
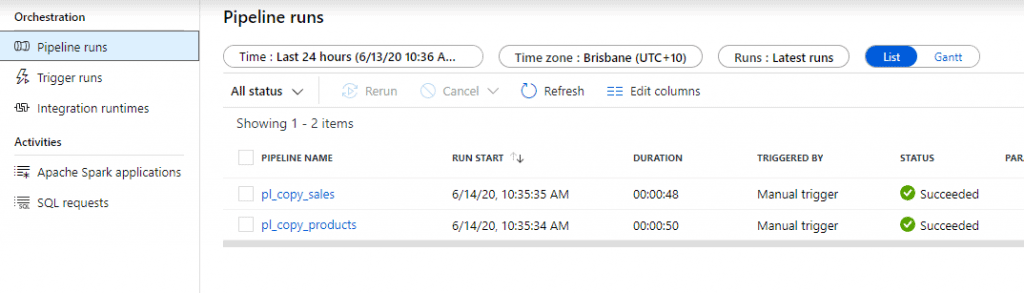
Pipeline runs
In the pipeline runs, you are able to see all pipeline activities executed in the workspace, including manual or triggered runs.
You can:
- Monitor pipeline run and activity run details
- Track all or specific pipelines by using filters
- Find the root cause of pipeline failure or activity failure
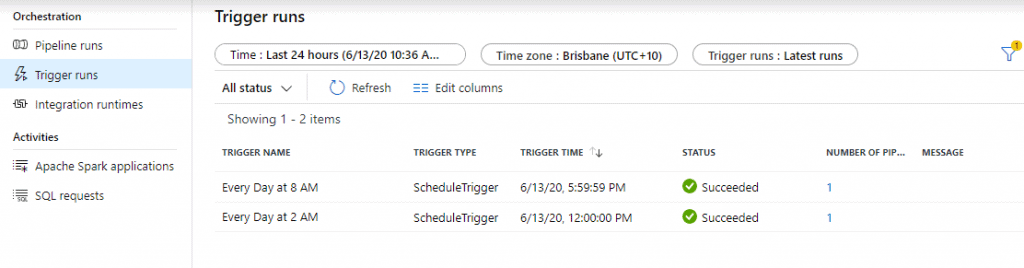
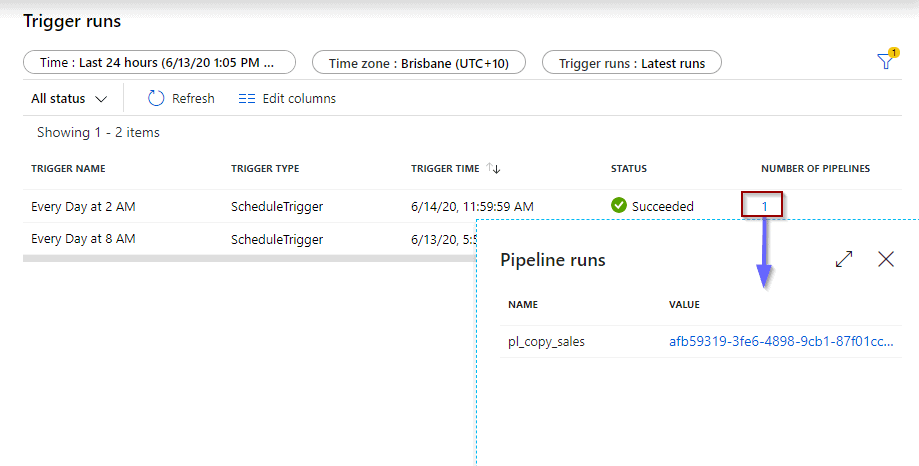
Trigger runs
This section only displays the trigger names and their pipeline executions. The difference between pipeline and trigger runs is that you see the execution information.
Integration runtimes
In the integration runtimes section, you can monitor the status of the integration runtimes – if they are running or unavailable.
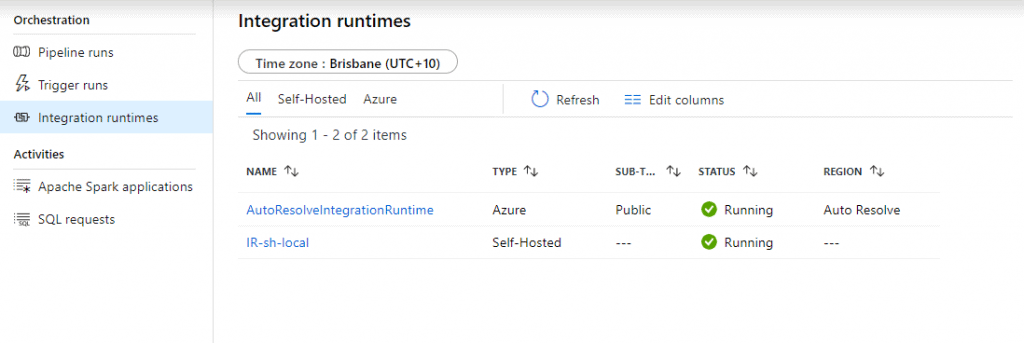
As covered in my previous blog post, there are 3 main types of integration runtimes:
- Azure: execute workloads between Azure services or Azure Data Factory Mapping Data Flows.
- Self-Hosted: execute workloads between on-premises environments and Azure.
- Azure-SSIS: execute SQL Server Integration Services packages in Azure Data Factory.
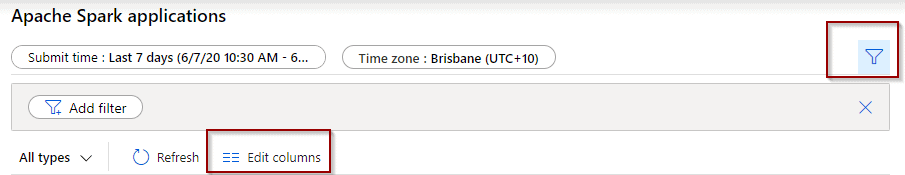
Apache Spark applications
It’s possible to monitor Apache Spark cluster activities. With this section you can:
Monitor the usage of Apache Spark clusters and apply filters
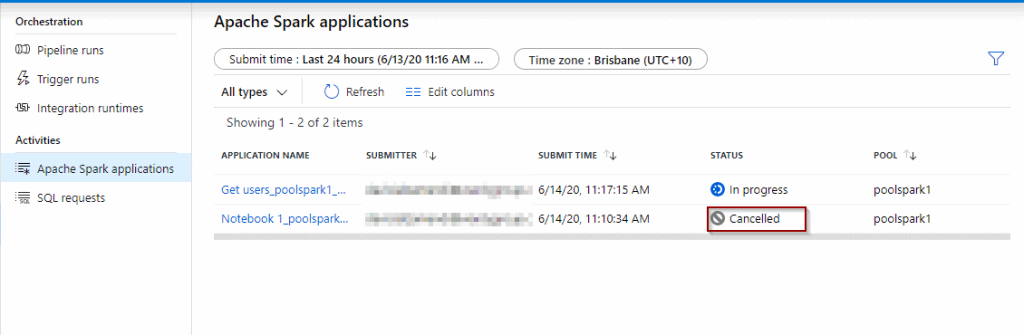
Surprisingly, the status changes to “cancelled” when you close the notebook, even if there were no failures in the notebook.
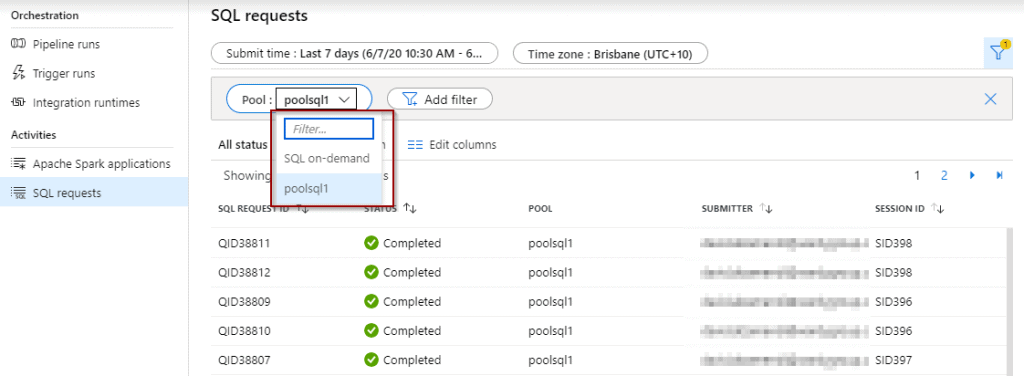
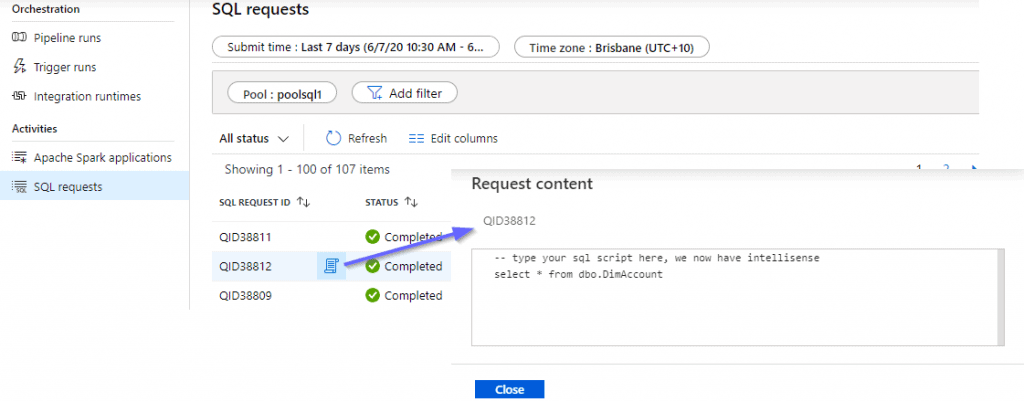
SQL requests
My preferred section within the Azure Synapse Analytics Manage Hub is SQL requests. You can monitor SQL activity, including the duration of the query and the query command for any of your SQL clusters, on-demand or provision.
You can:
- Understand if you need to scale resources out or back
- Have access to SQL logs
- Review the final status of SQL Activities
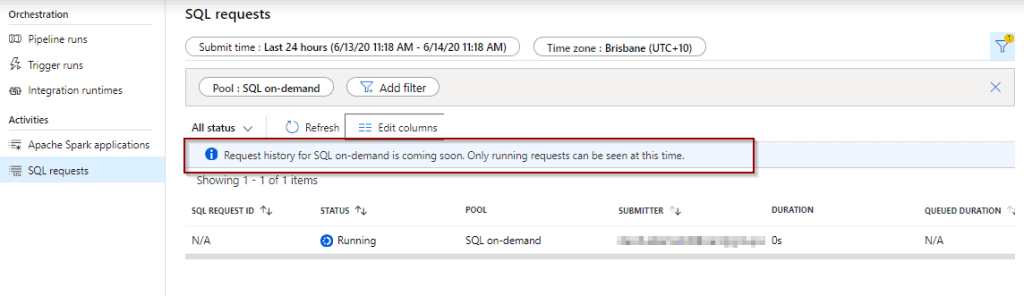
For SQL on-demand, soon it will be possible to see historical execution information.
Summary
With the Azure Synapse Analytics Monitor hub, you can monitor most of the activity within a workspace and look at the status of activities, Apache Spark or SQL queries.
What’s next?
Looking ahead, I’ll be posting on some of the other features within Azure Synapse Analytics. Please leave a comment if there is anything that you would like to learn about.

1 Response
Kachi
15 . 03 . 2022Thank you this article. Kindly update the Monitor Hub to include the “Data Flow Debug” activity.
Thank you.